Tell Your Story with Text Cards and Annotations
Your metrics give you insight into your actual data, both for how you did in the past and how you're progressing in the present, but they can't always give a complete picture of what a specific metri…
Your metrics give you insight into your actual data, both for how you did in the past and how you're progressing in the present, but they can't always give a complete picture of what a specific metric is tracking, why it matters or what the ultimate goal is.
TargetBoard offers two powerful tools to add to your boards and metrics to do exactly that: Text Cards and Annotations.
Tool | Description | Use it for |
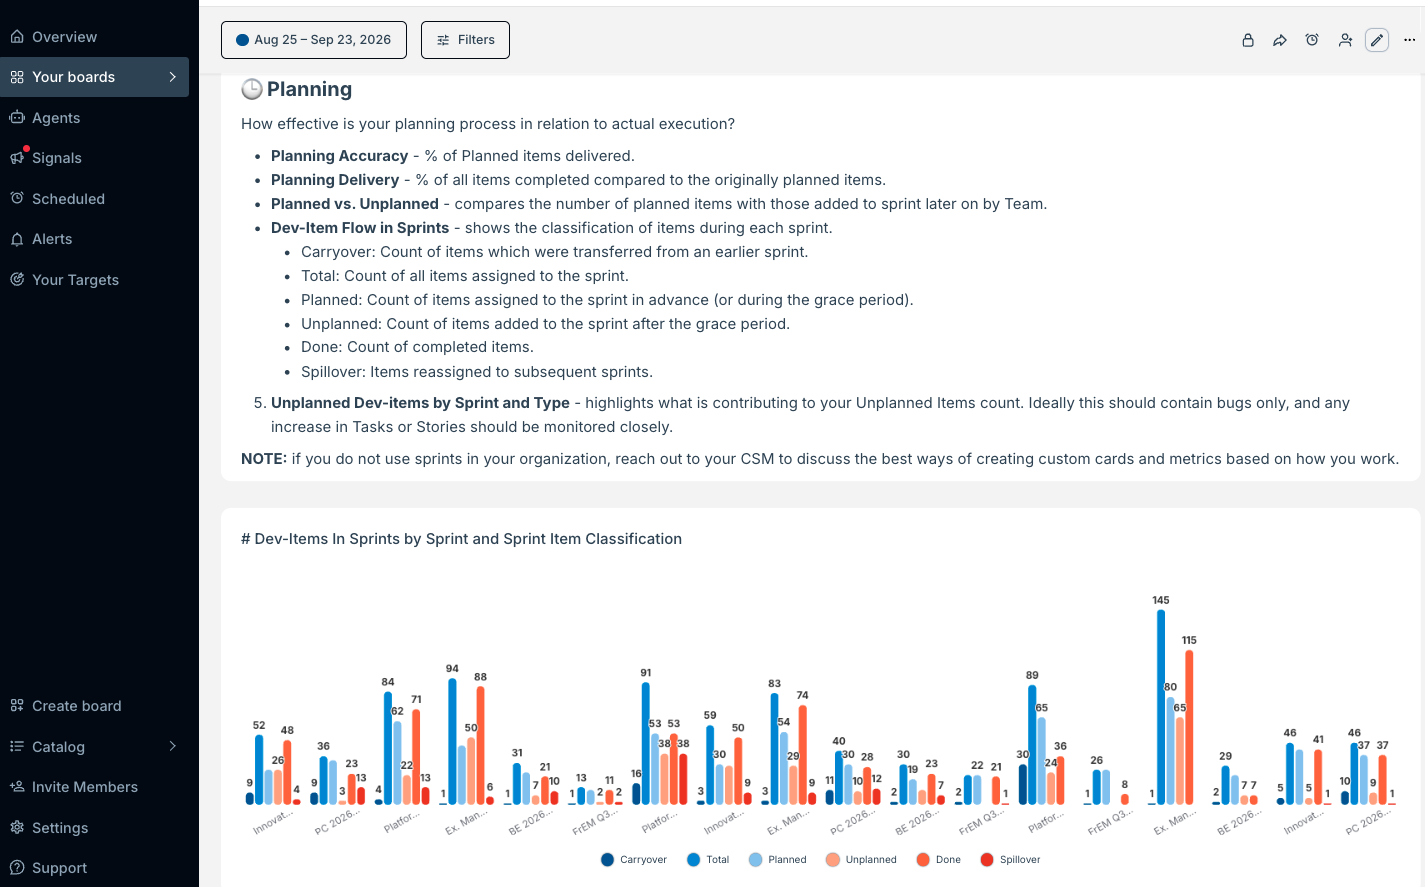
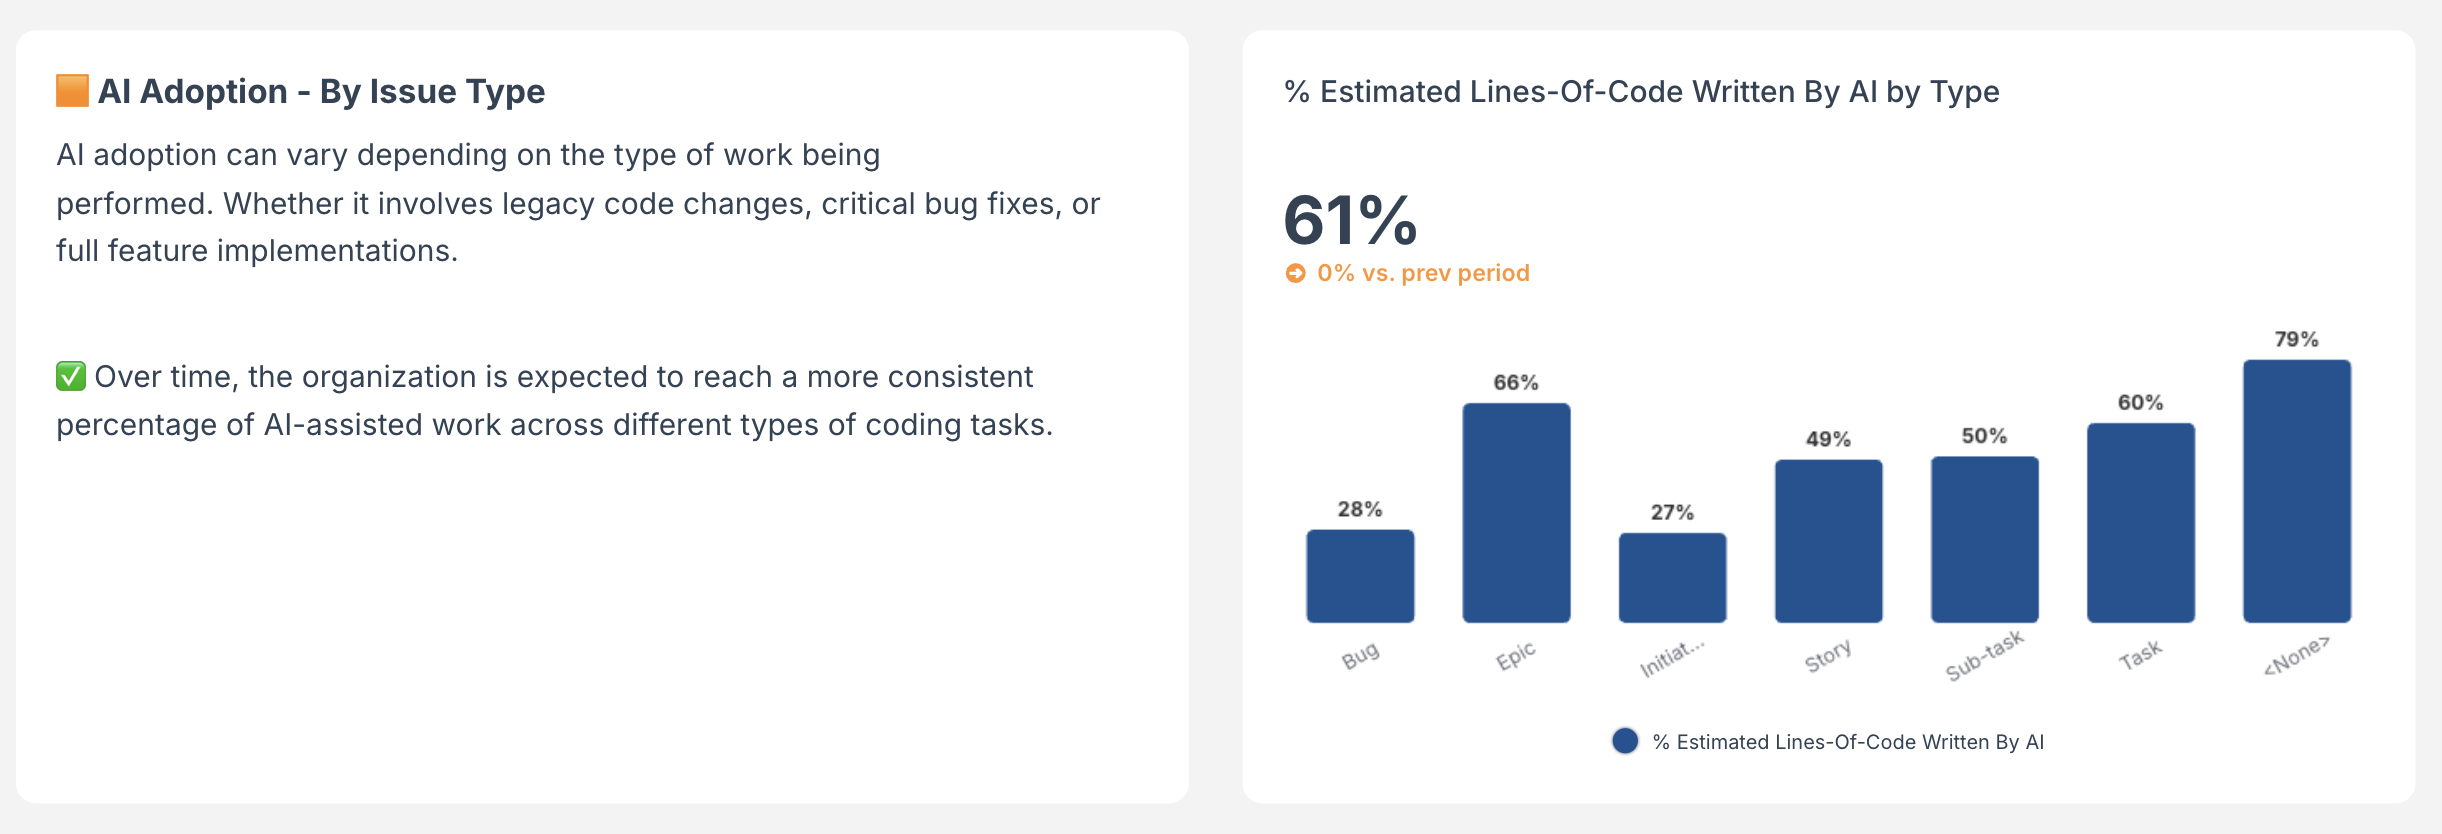
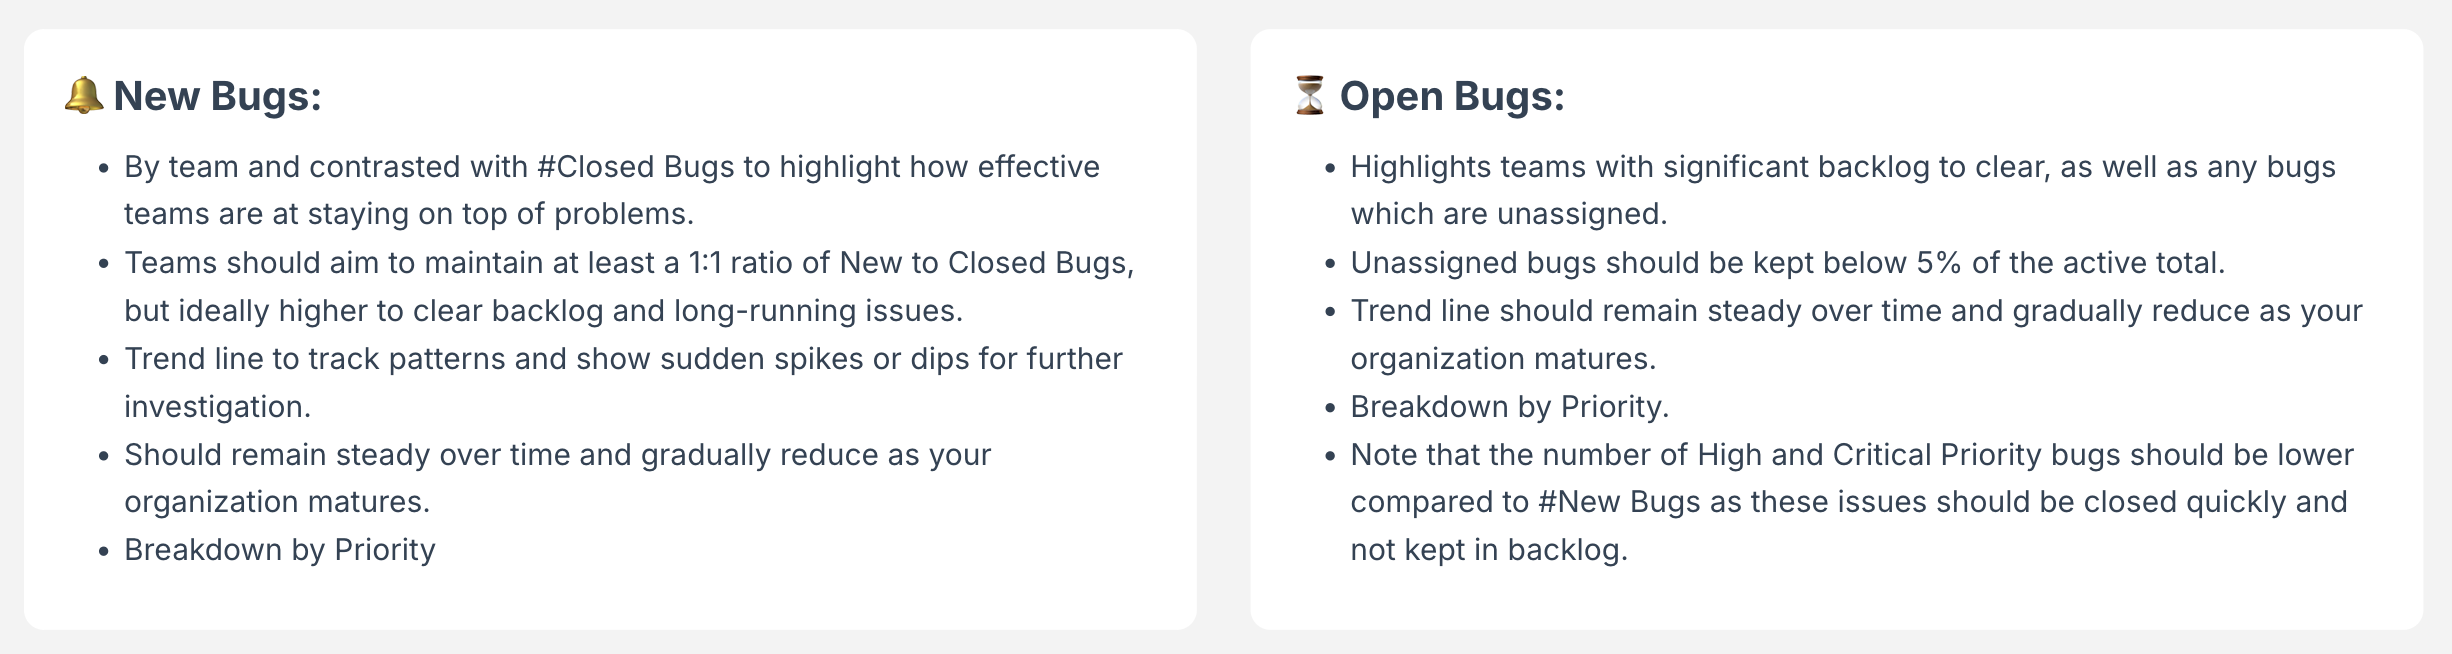
Text Card | Editable free-text cards which can be added to any board along with your metric cards. | Text cards are incredibly flexible, use them to divide your boards into easy-to-read subsections, explain the purpose of your board to new users, give definitions and context for key metrics about what you're actually trying to measure and the goals your organization is aiming to meet. |
Annotation | A note pinned to a specific point in time on a metric to give additional context or information. | Annotations can be made private to you or public to your account and are best used to explain a spike or dip in your metrics, mark a release, incident or process change. |
These tools can be made even more powerful when used together, with annotations on the metric timeline to explain individual moments and text cards to tie those moments together into a clear story about your data.
Text Cards
Your text cards work in much the same way as the metric cards on your boards, they can be resized and moved to sit next to the metrics (or group of metrics).
Adding a Text Card to a Board
- Open whichever dashboard you want to add a text card to.
- Click on the edit icon in the top right corner of the screen. Click on either the Add cards button in the side menu or + between the cards already on your board and choose Text card.
- Using the side menu will place your new card at the bottom of the board, while any + will place the card at that location.
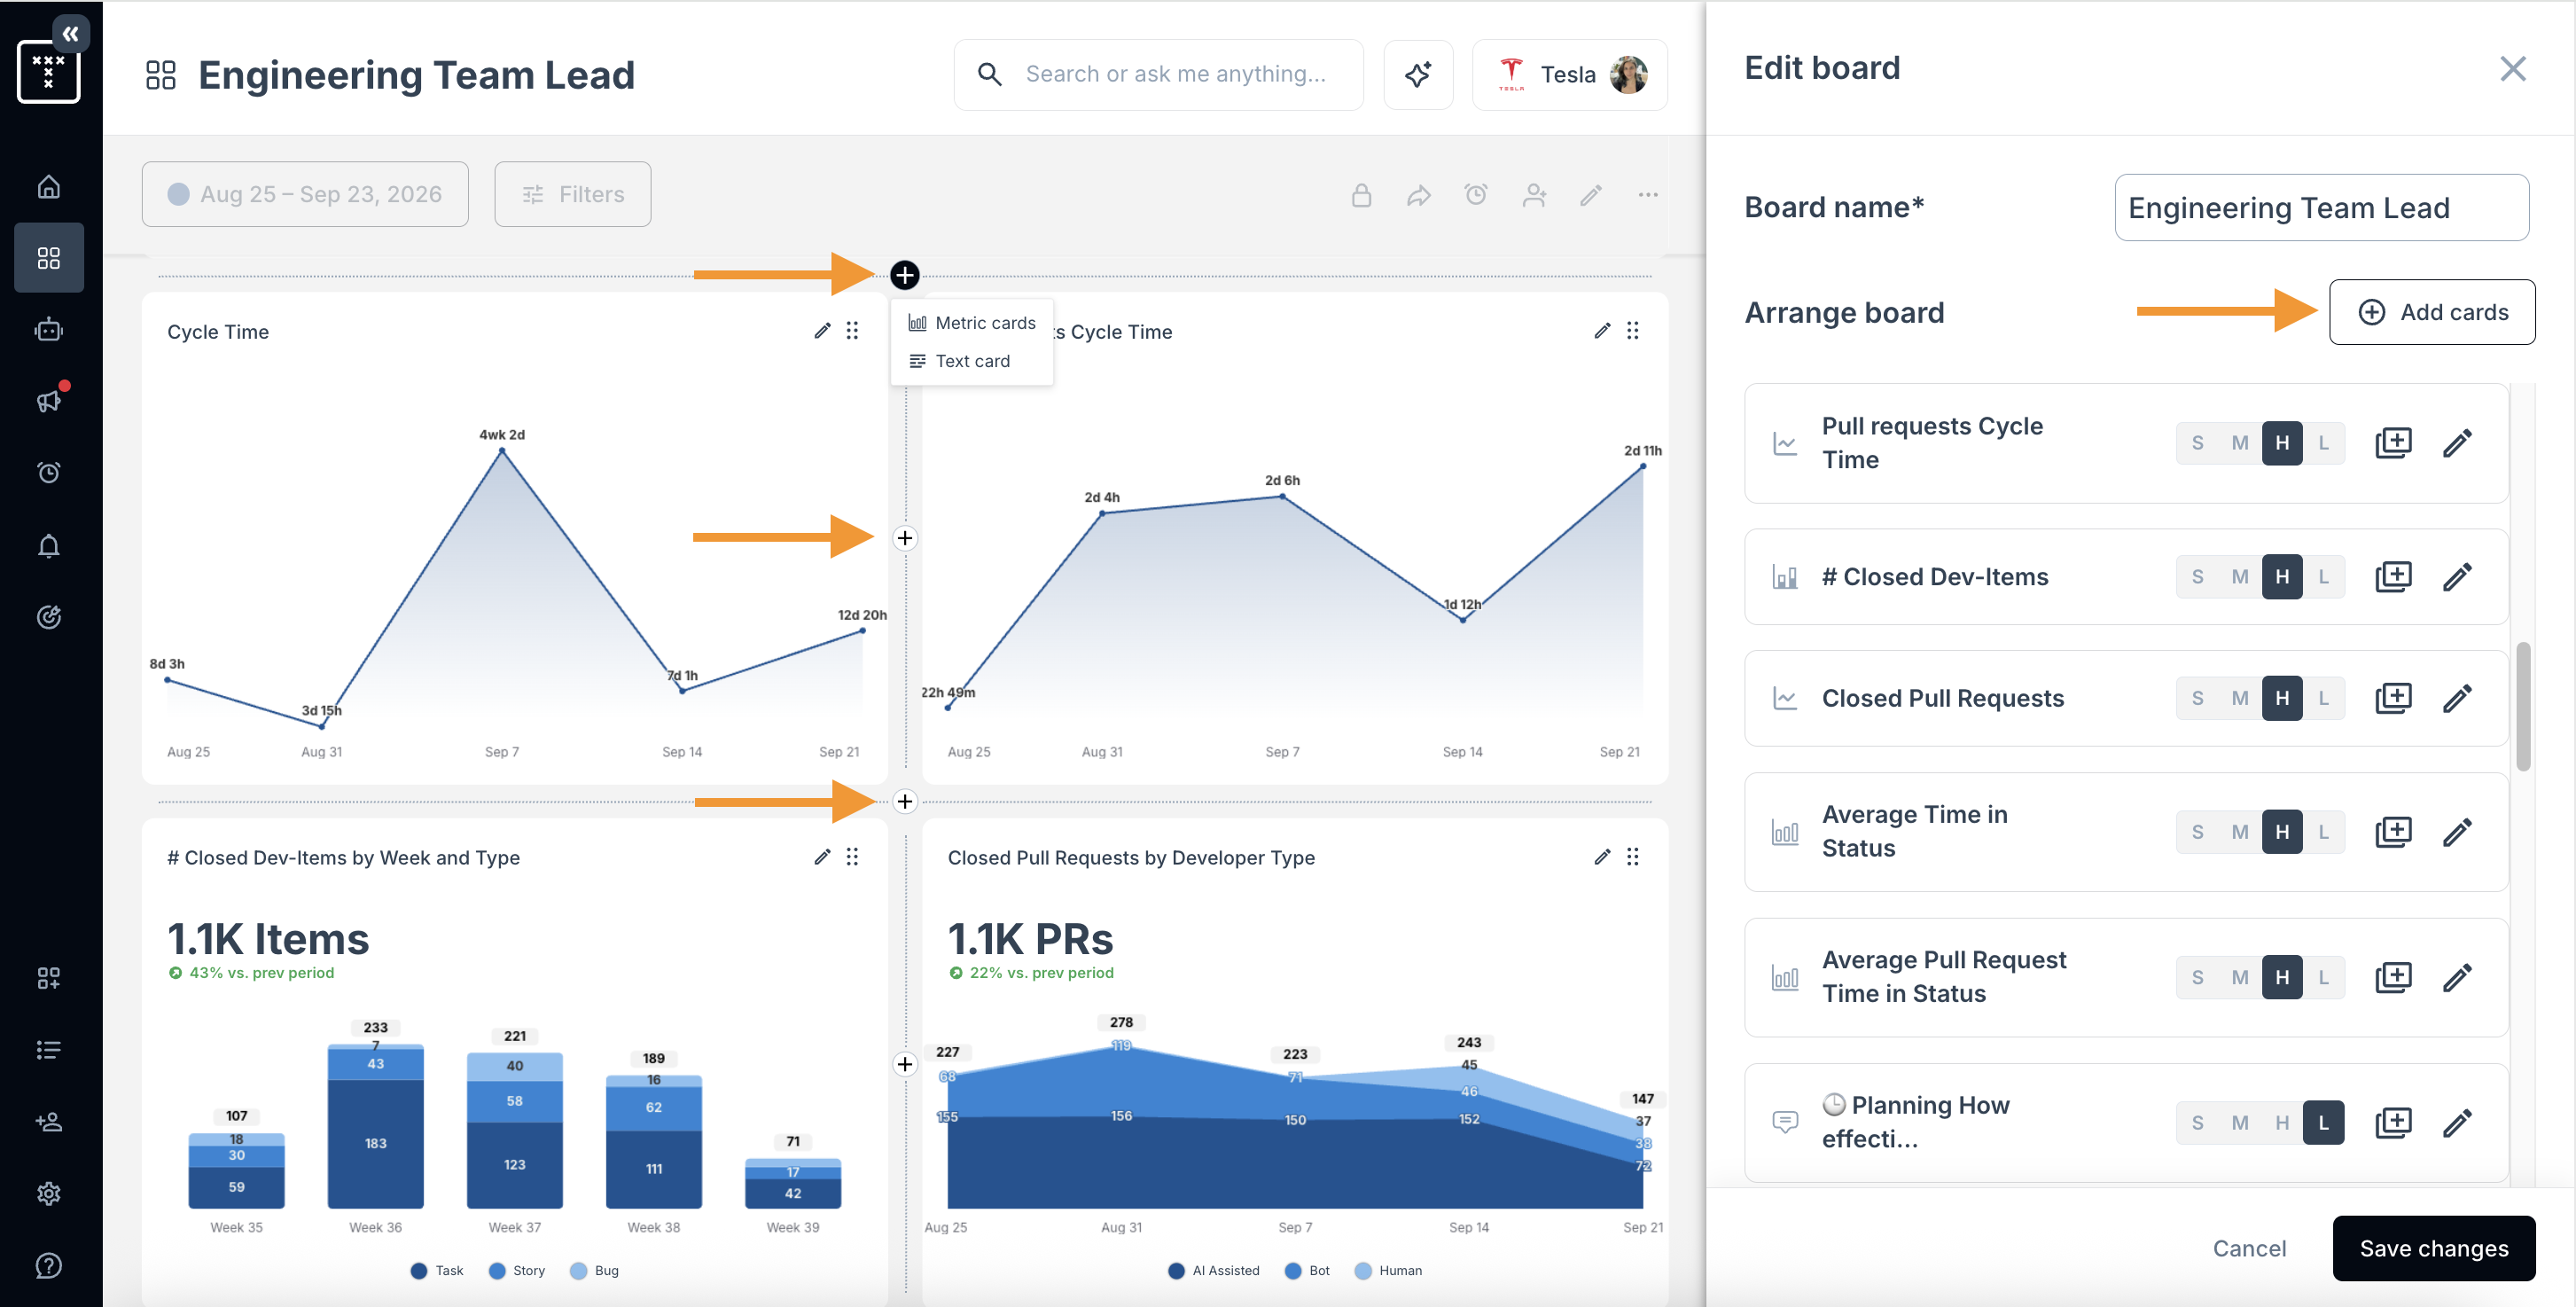
- The side menu will become an interface where you can choose your card size, write and format your text. Once you're happy with your text, click Apply changes and the card will appear on your board.
Once you have your card in place, you can move, update or edit it at any time.
Examples:
Annotations
Annotations are added to specific metrics to create a log of events or changes in your organization that can help contextualize the data you see in the metric.
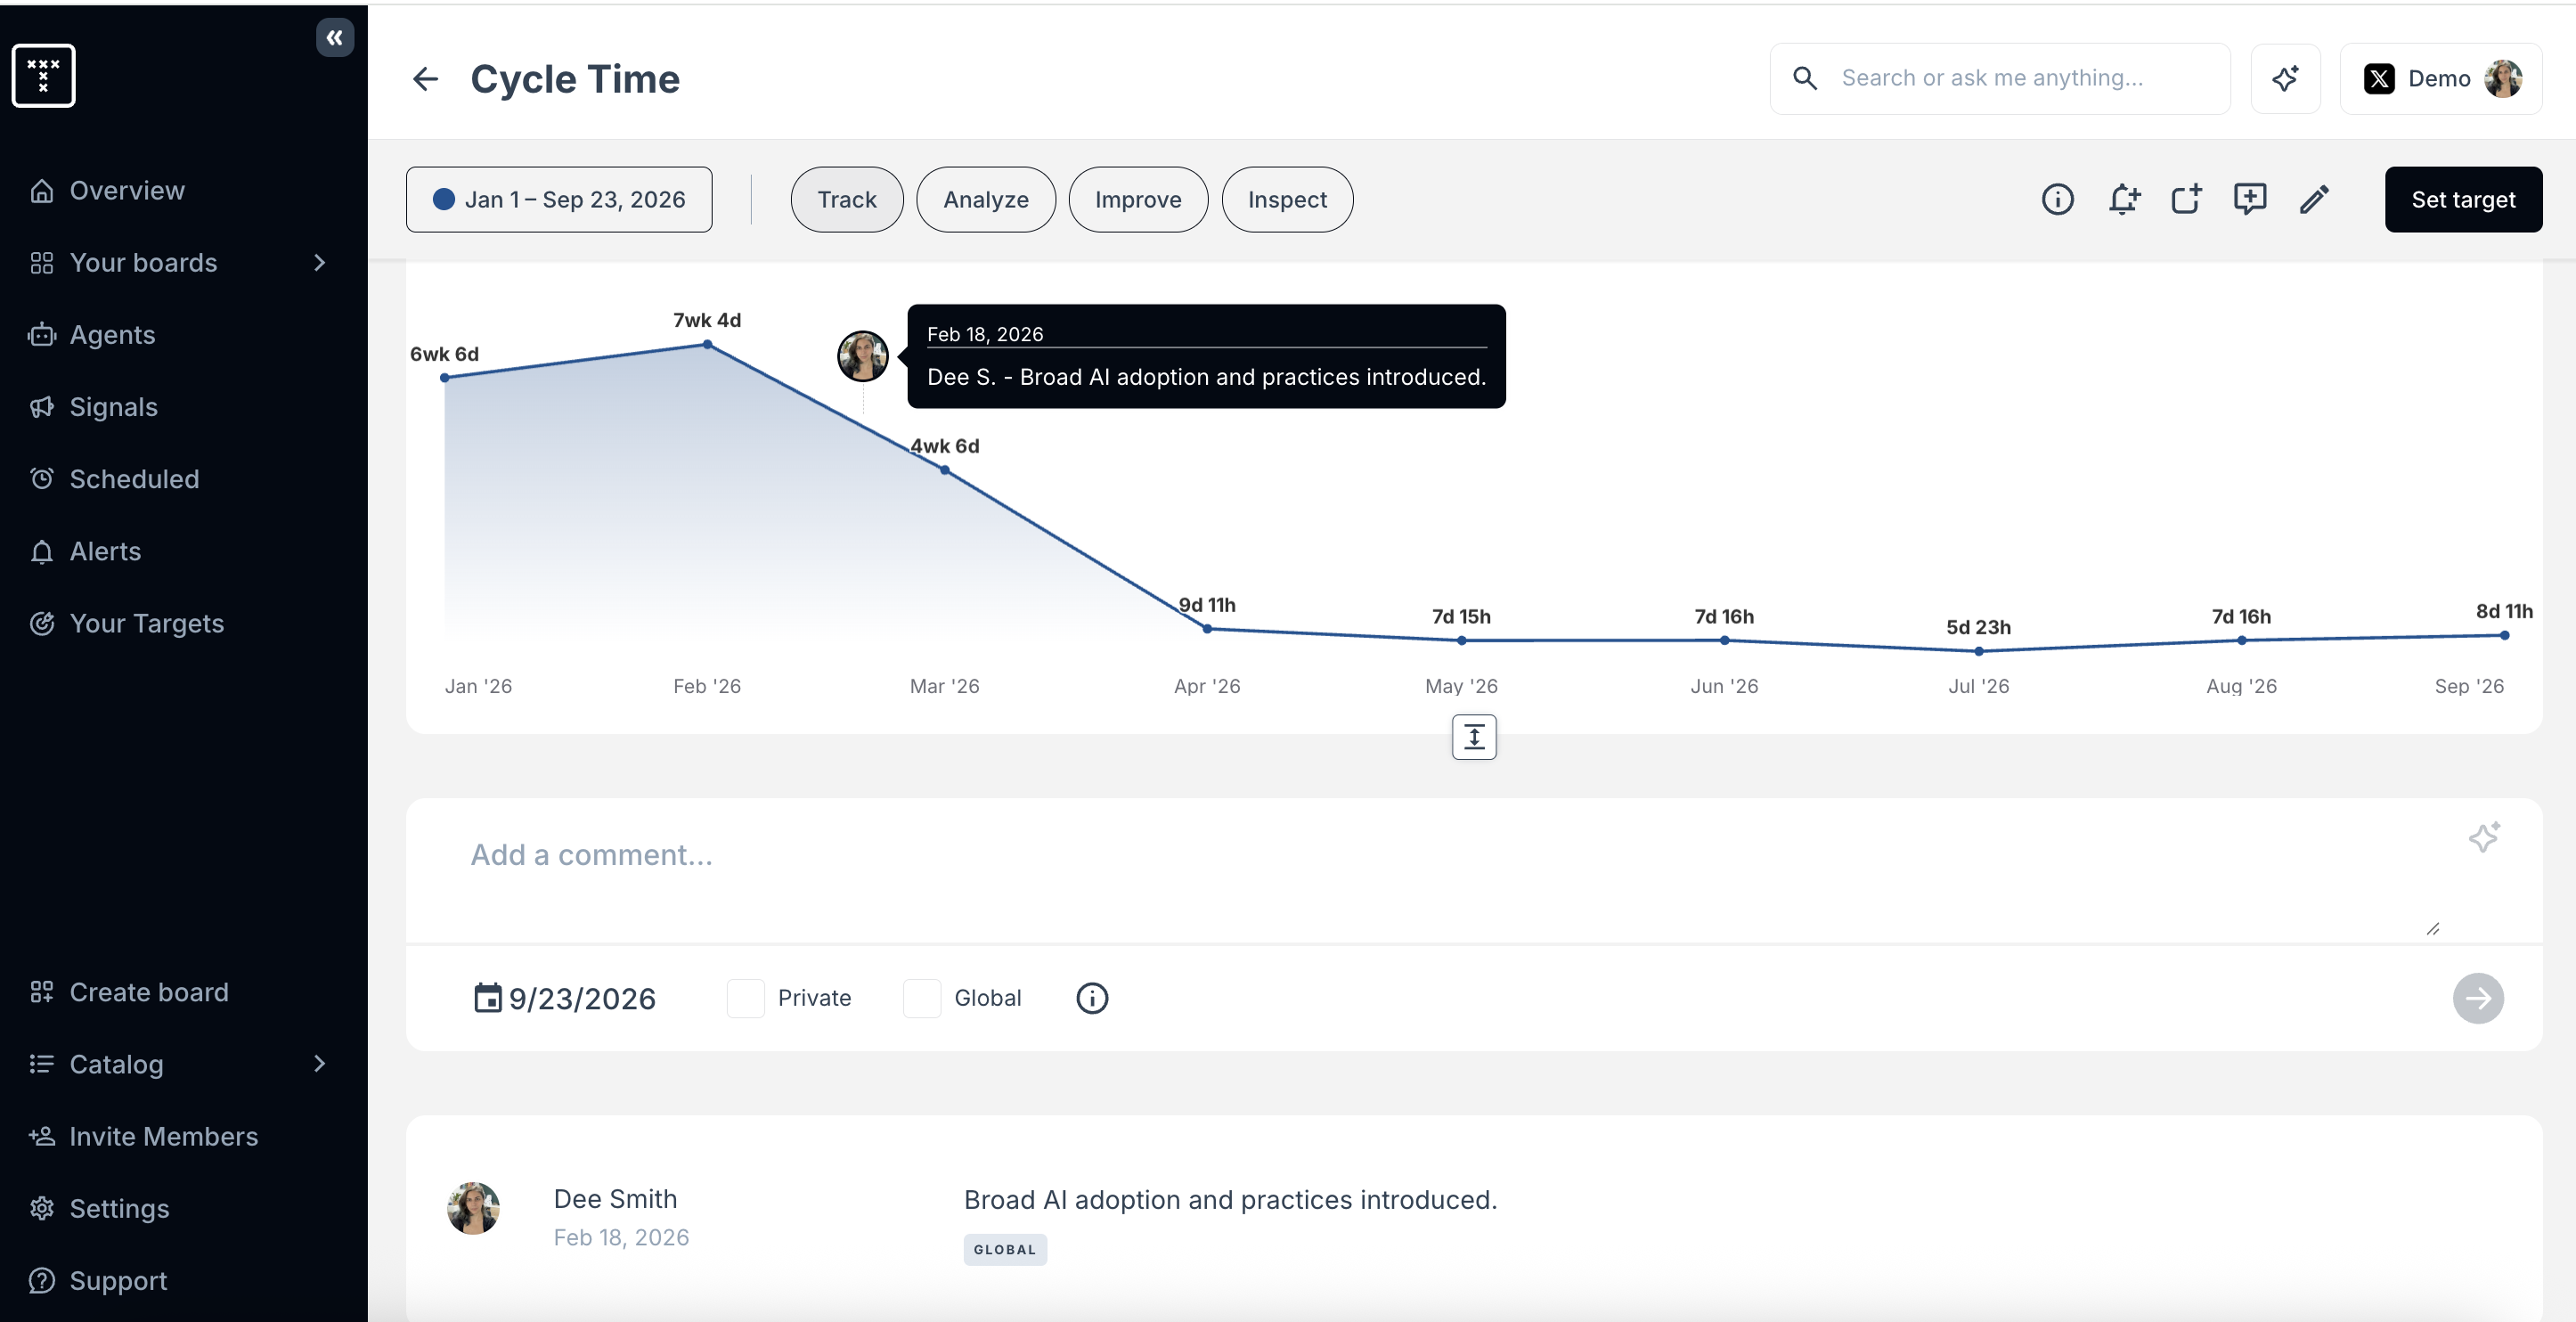
In the example used below, we're making a comment of when an organization started a full rollout of AI use to their development teams so we can track the impact of that change on their Cycle Time in the time since.
Adding an Annotation to a Metric
- Navigate to the Track tab of any metric.
- You can do this by either clicking on the metric card or looking for it in the search bar.
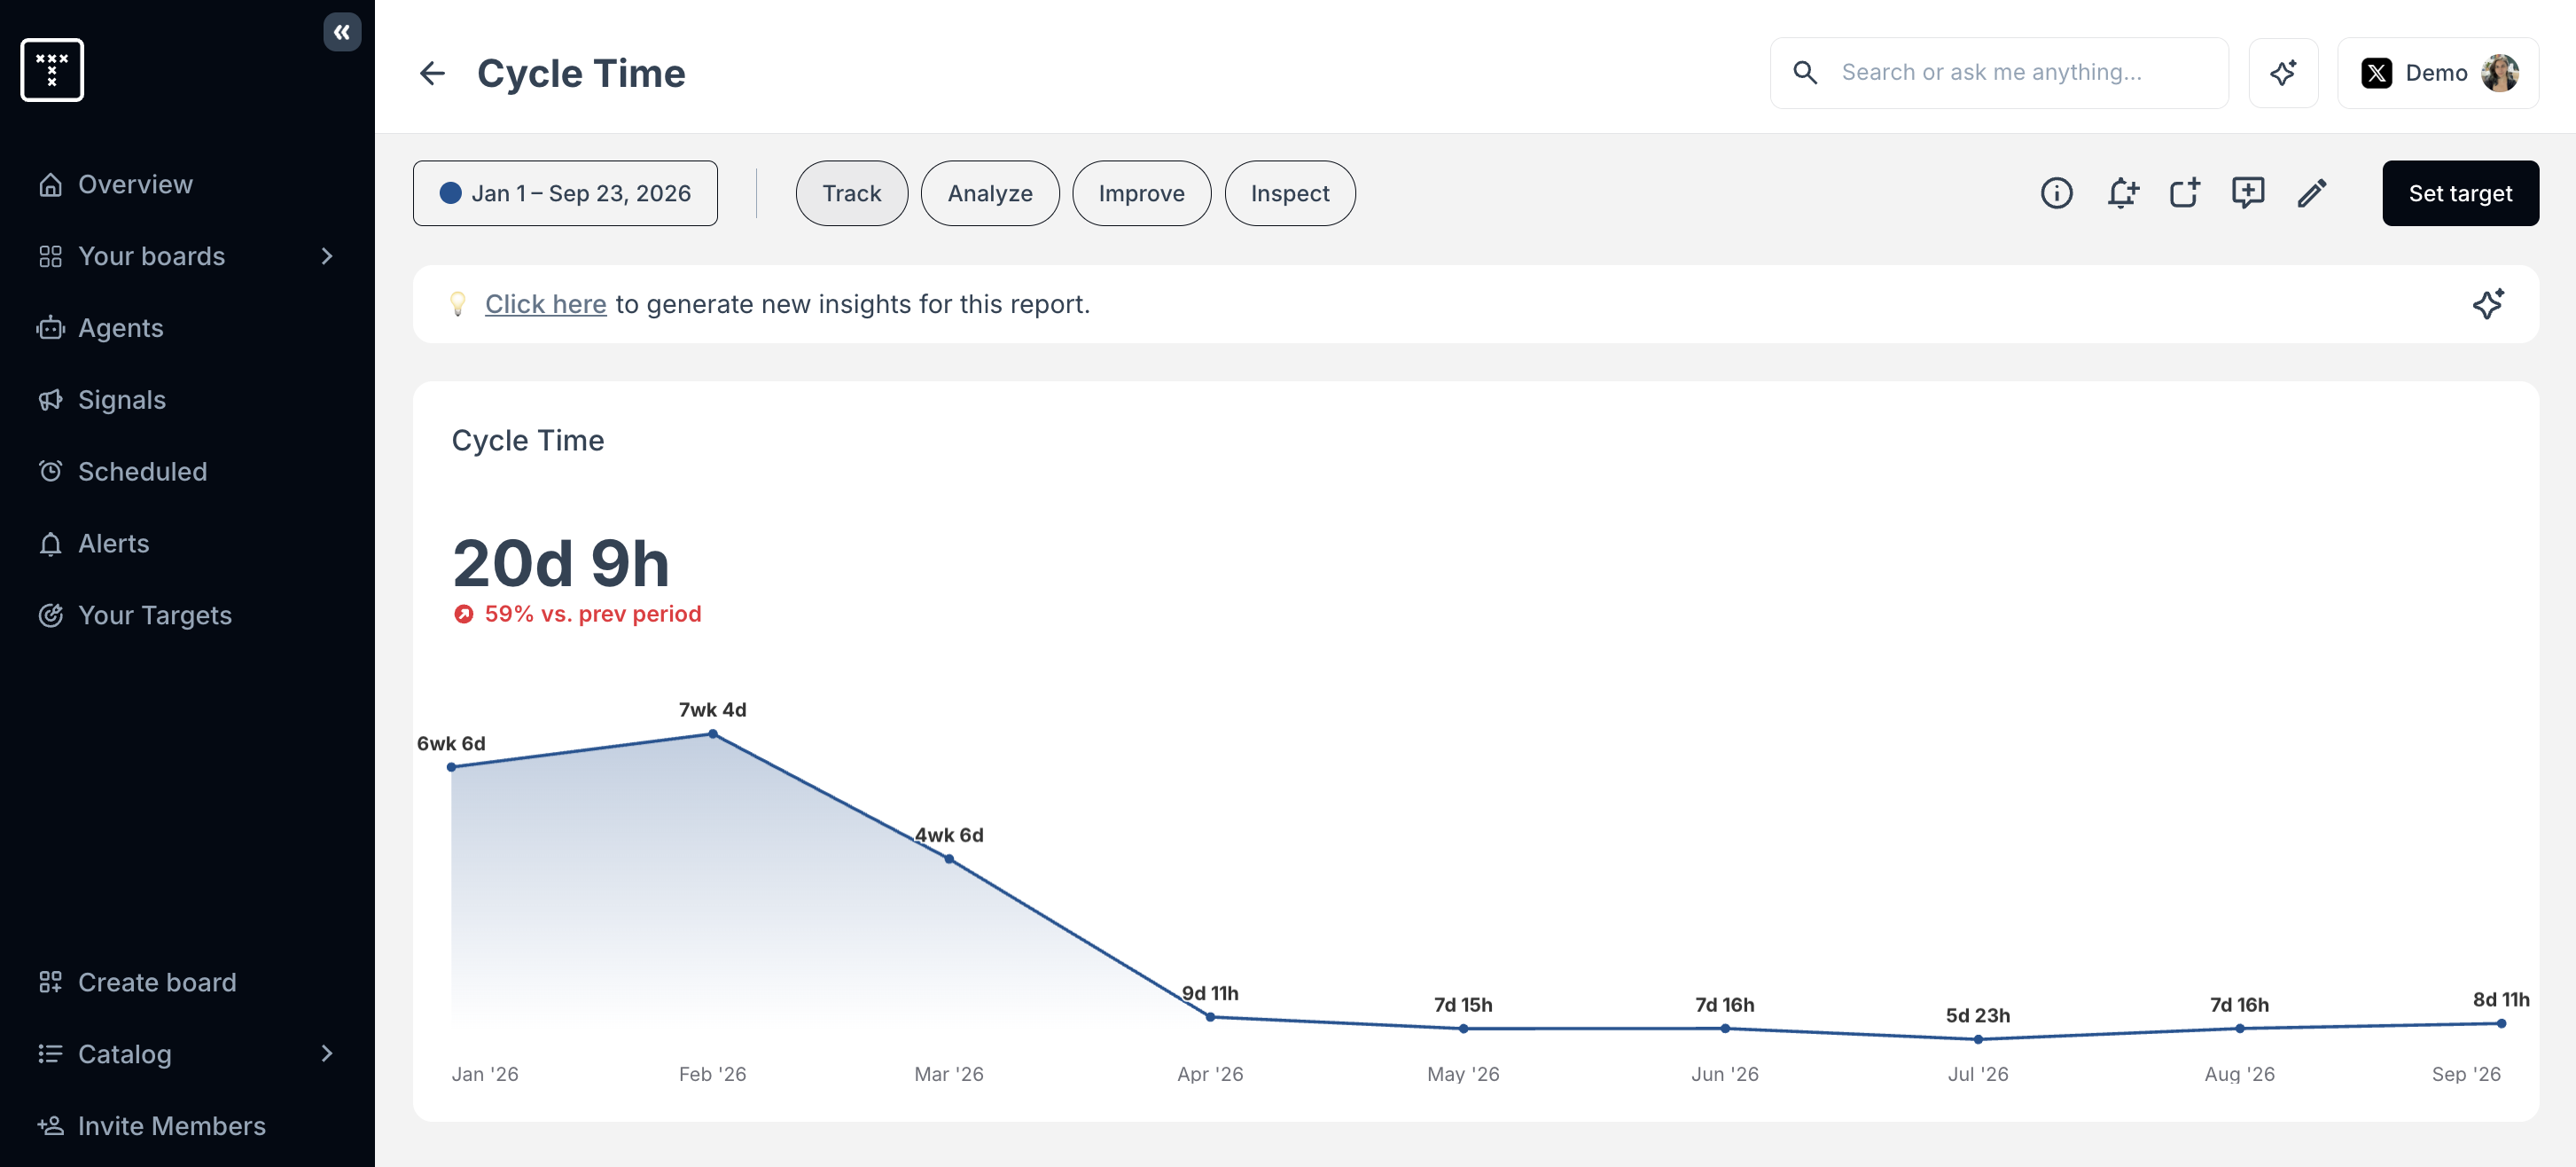
- Scroll down slightly and you'll see a section inviting you to add a note to this timeline.

- Add your note on the text line, select the date it should attach to and choose if the annotation should be private (visible only to you) or global (visible to all users in your account), and click Submit comment.
- Your annotation will now appear both on the timeline where it it can easily be seen in relation to changes in the metric and at the bottom of the page as part of a running log of all notes made on the metric.
Other Sample Uses:
- Significant process changes, restructuring, new hires or holiday periods.
- Releases, deployments and feature launches.
- Impactful incidents and outages.
- Tooling changes.
- Company or even broader events which impact numbers e.g: a company retreat causing a sharp dip in productivity. Without a note this can look like a serious issue which needs to be investigated and addressed.
How did we do?
Connecting to TargetBoard's MCP Server
Core Concepts & Terms
