Core Concepts & Terms
Explaining concepts and terms you'll see throughout TargetBoard's documentation and use in the platform.
Metrics
A measure used to track and assess the status of specific processes or goals. All metrics in your account can be seen in your Catalog (including core, custom and filtered metrics), and are organized based on metric area.
These metrics are the backbone of TargetBoard and can be added to any of your boards to make decisions based on real data across all your connected systems and visualized in a variety of ways both to show your current status, and also to accurately track progress over time.
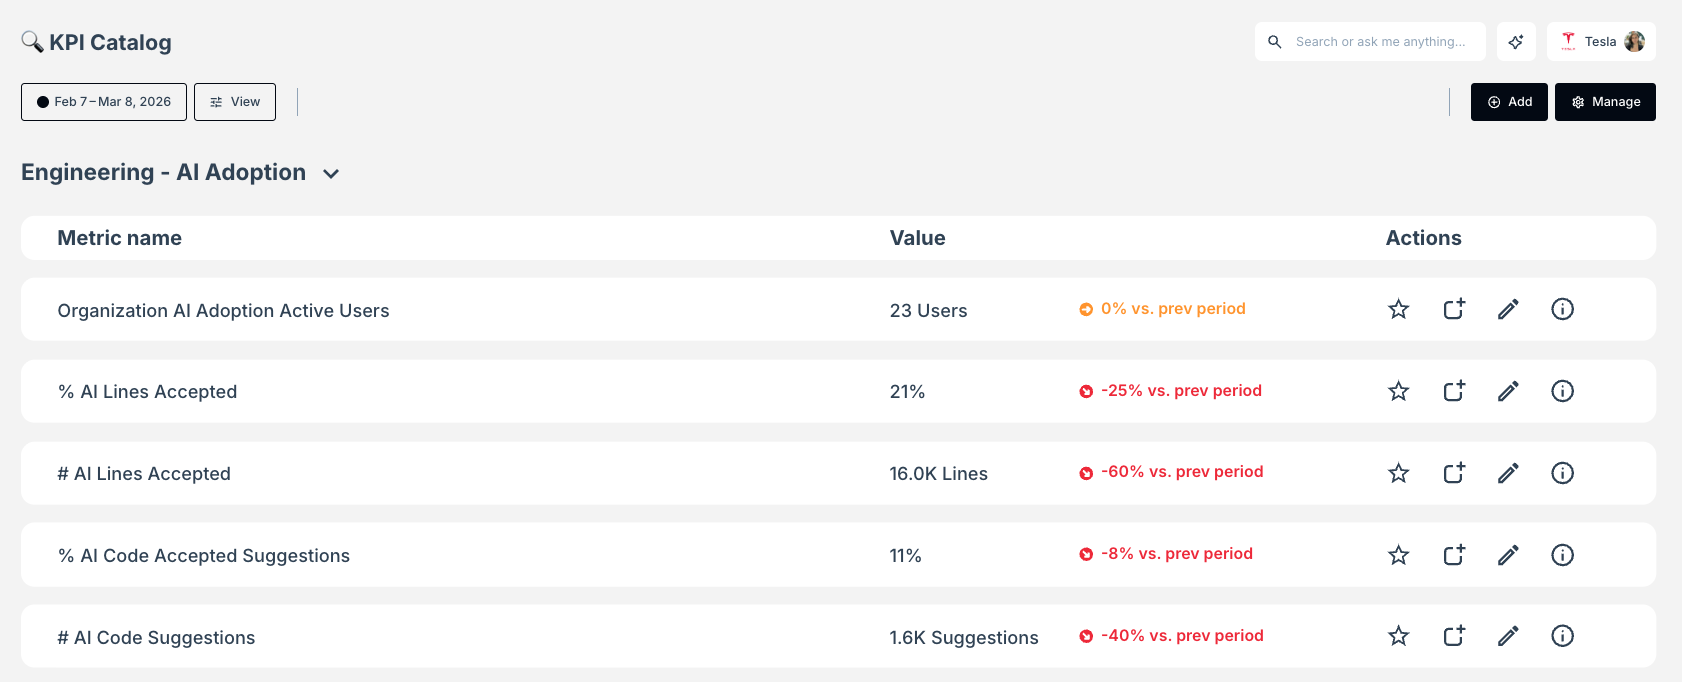
Core Metrics
Core Metrics are the top level of the metric hierarchy in your TargetBoard account and and have no additional filters added yet. The core metrics available in your account are determined by your connected integrations and the use cases defined in your agreement.
For example, if you have Jira, GitHub, GitHub Copilot and Zendesk connected and are using TargetBoard for your Engineering, Product and Support teams, then all metrics and models from those sources and relevant to those teams will be enabled for your use in your workspace.
Custom Metrics
Need something more complicated or with definitions that are not industry standard? Want to track something based on a specific key result that is difficult to see in your own systems or that you currently do manually in spreadsheets? This is where custom metrics come in.
These are also top level metrics, but will only be available within your own workspace and will be built to show exactly what you need to based on your specific requirements. These can include both completely novel concepts that are unique to your organization, as well as more complicated metrics which often require custom logic based on how you work (eg: DORA metrics).
Custom metrics allow you to get everything you need to work better, without having to change how you work in order to get actionable intelligence.
Contact your Customer Success Manager to discuss any custom requirements and they'll work with you to deliver what you need.
Filtered Metrics
A metric with additional filters applied to show a more specific subset of information. Best used if the same filters or definitions will be needed in multiple boards or by multiple people. Eg: Backend Team Cycle Time or New Critical Bugs.
These allow you to create multiple different metrics that you can compare and contrast without needing to manually add the same filters to every board or card where you want to see this specific data. Filtered metrics will also appear in the Catalog indented under the core metrics that they are derived from.
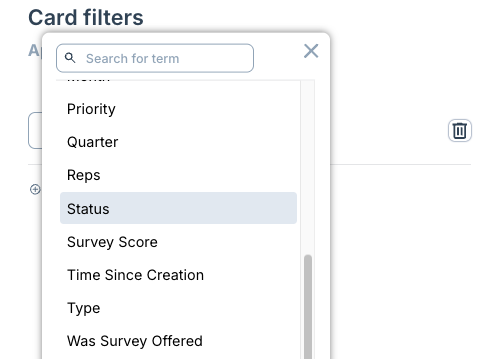
Dimensions
Dimensions are used to filter your data or create breakdowns on cards to best understand what is happening in your organization.
For each connected data source, TargetBoard has a number of default dimensions that are automatically included in your workspace.
For example, when looking at data coming from Jira you will automatically have dimensions enabled such as Type, Priority, Sprint, Team, Epic, Id, Label, Status etc.
Additionally, your Customer Success Manager will work with you to add any custom dimensions that you might need based on custom fields being used in your connected platforms. When needed custom logic and mapping can also be added to enable additional insights into your data.
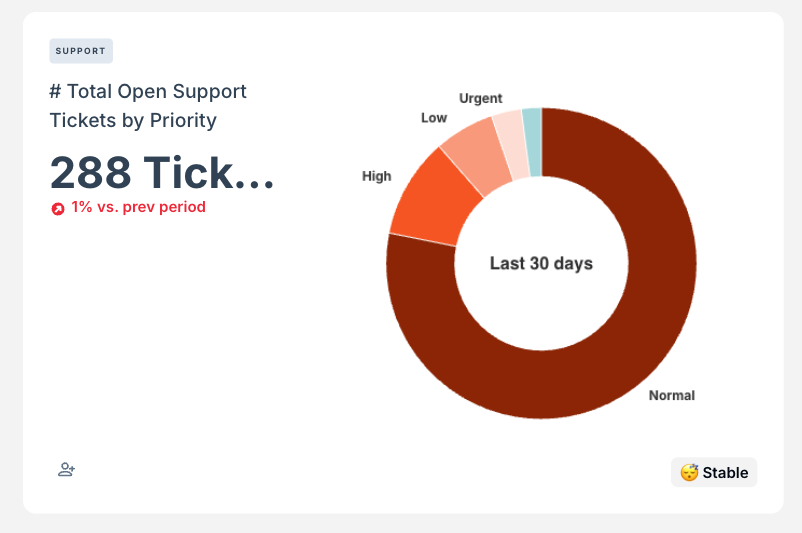
Below: Examples of dimensions available to use for filtering and used to offer a breakdown of Open Support Tickets by Priority.
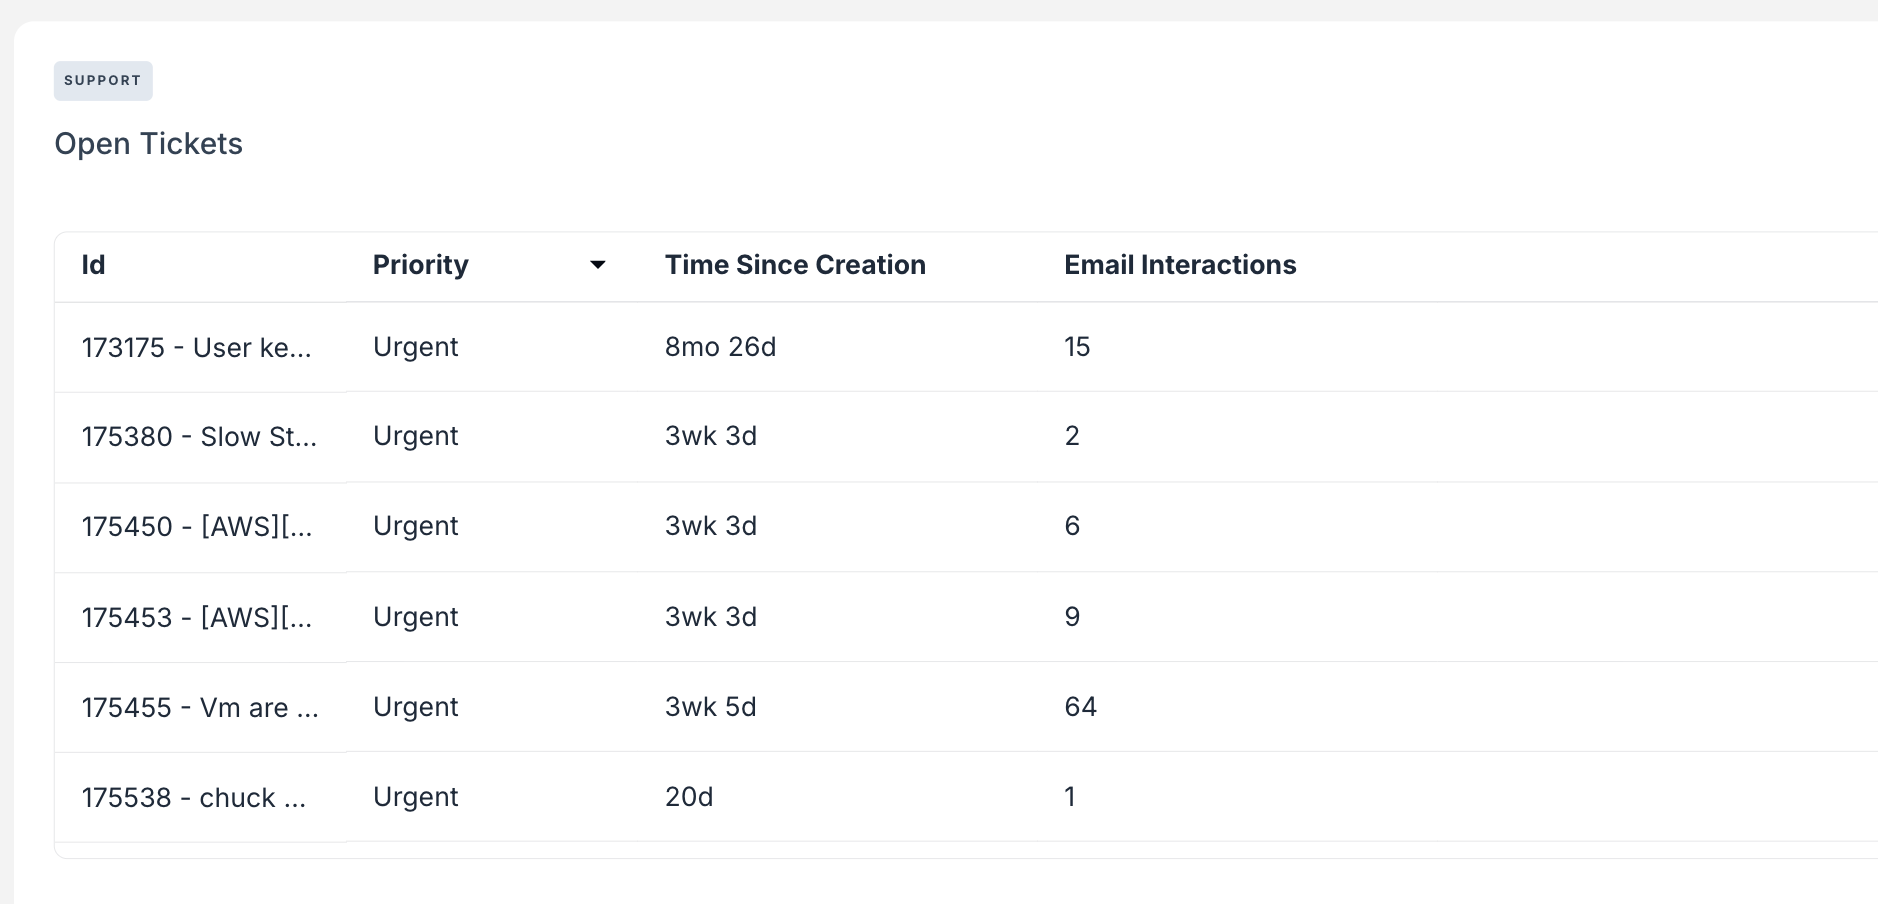
Facts
Facts are numbers or other pieces of information which cannot be used as dimensions, but are used in calculations and viewable in your workspace. For example, number of a Story Points, hours or dates.
If you want to see the precise breakdowns of facts related to specific metrics and get a holistic view of the data without constantly needing to do csv exports or manually updating spreadsheets, there are two great ways of doing this in TargetBoard.
Option 1: Create cards visualizing data in tables
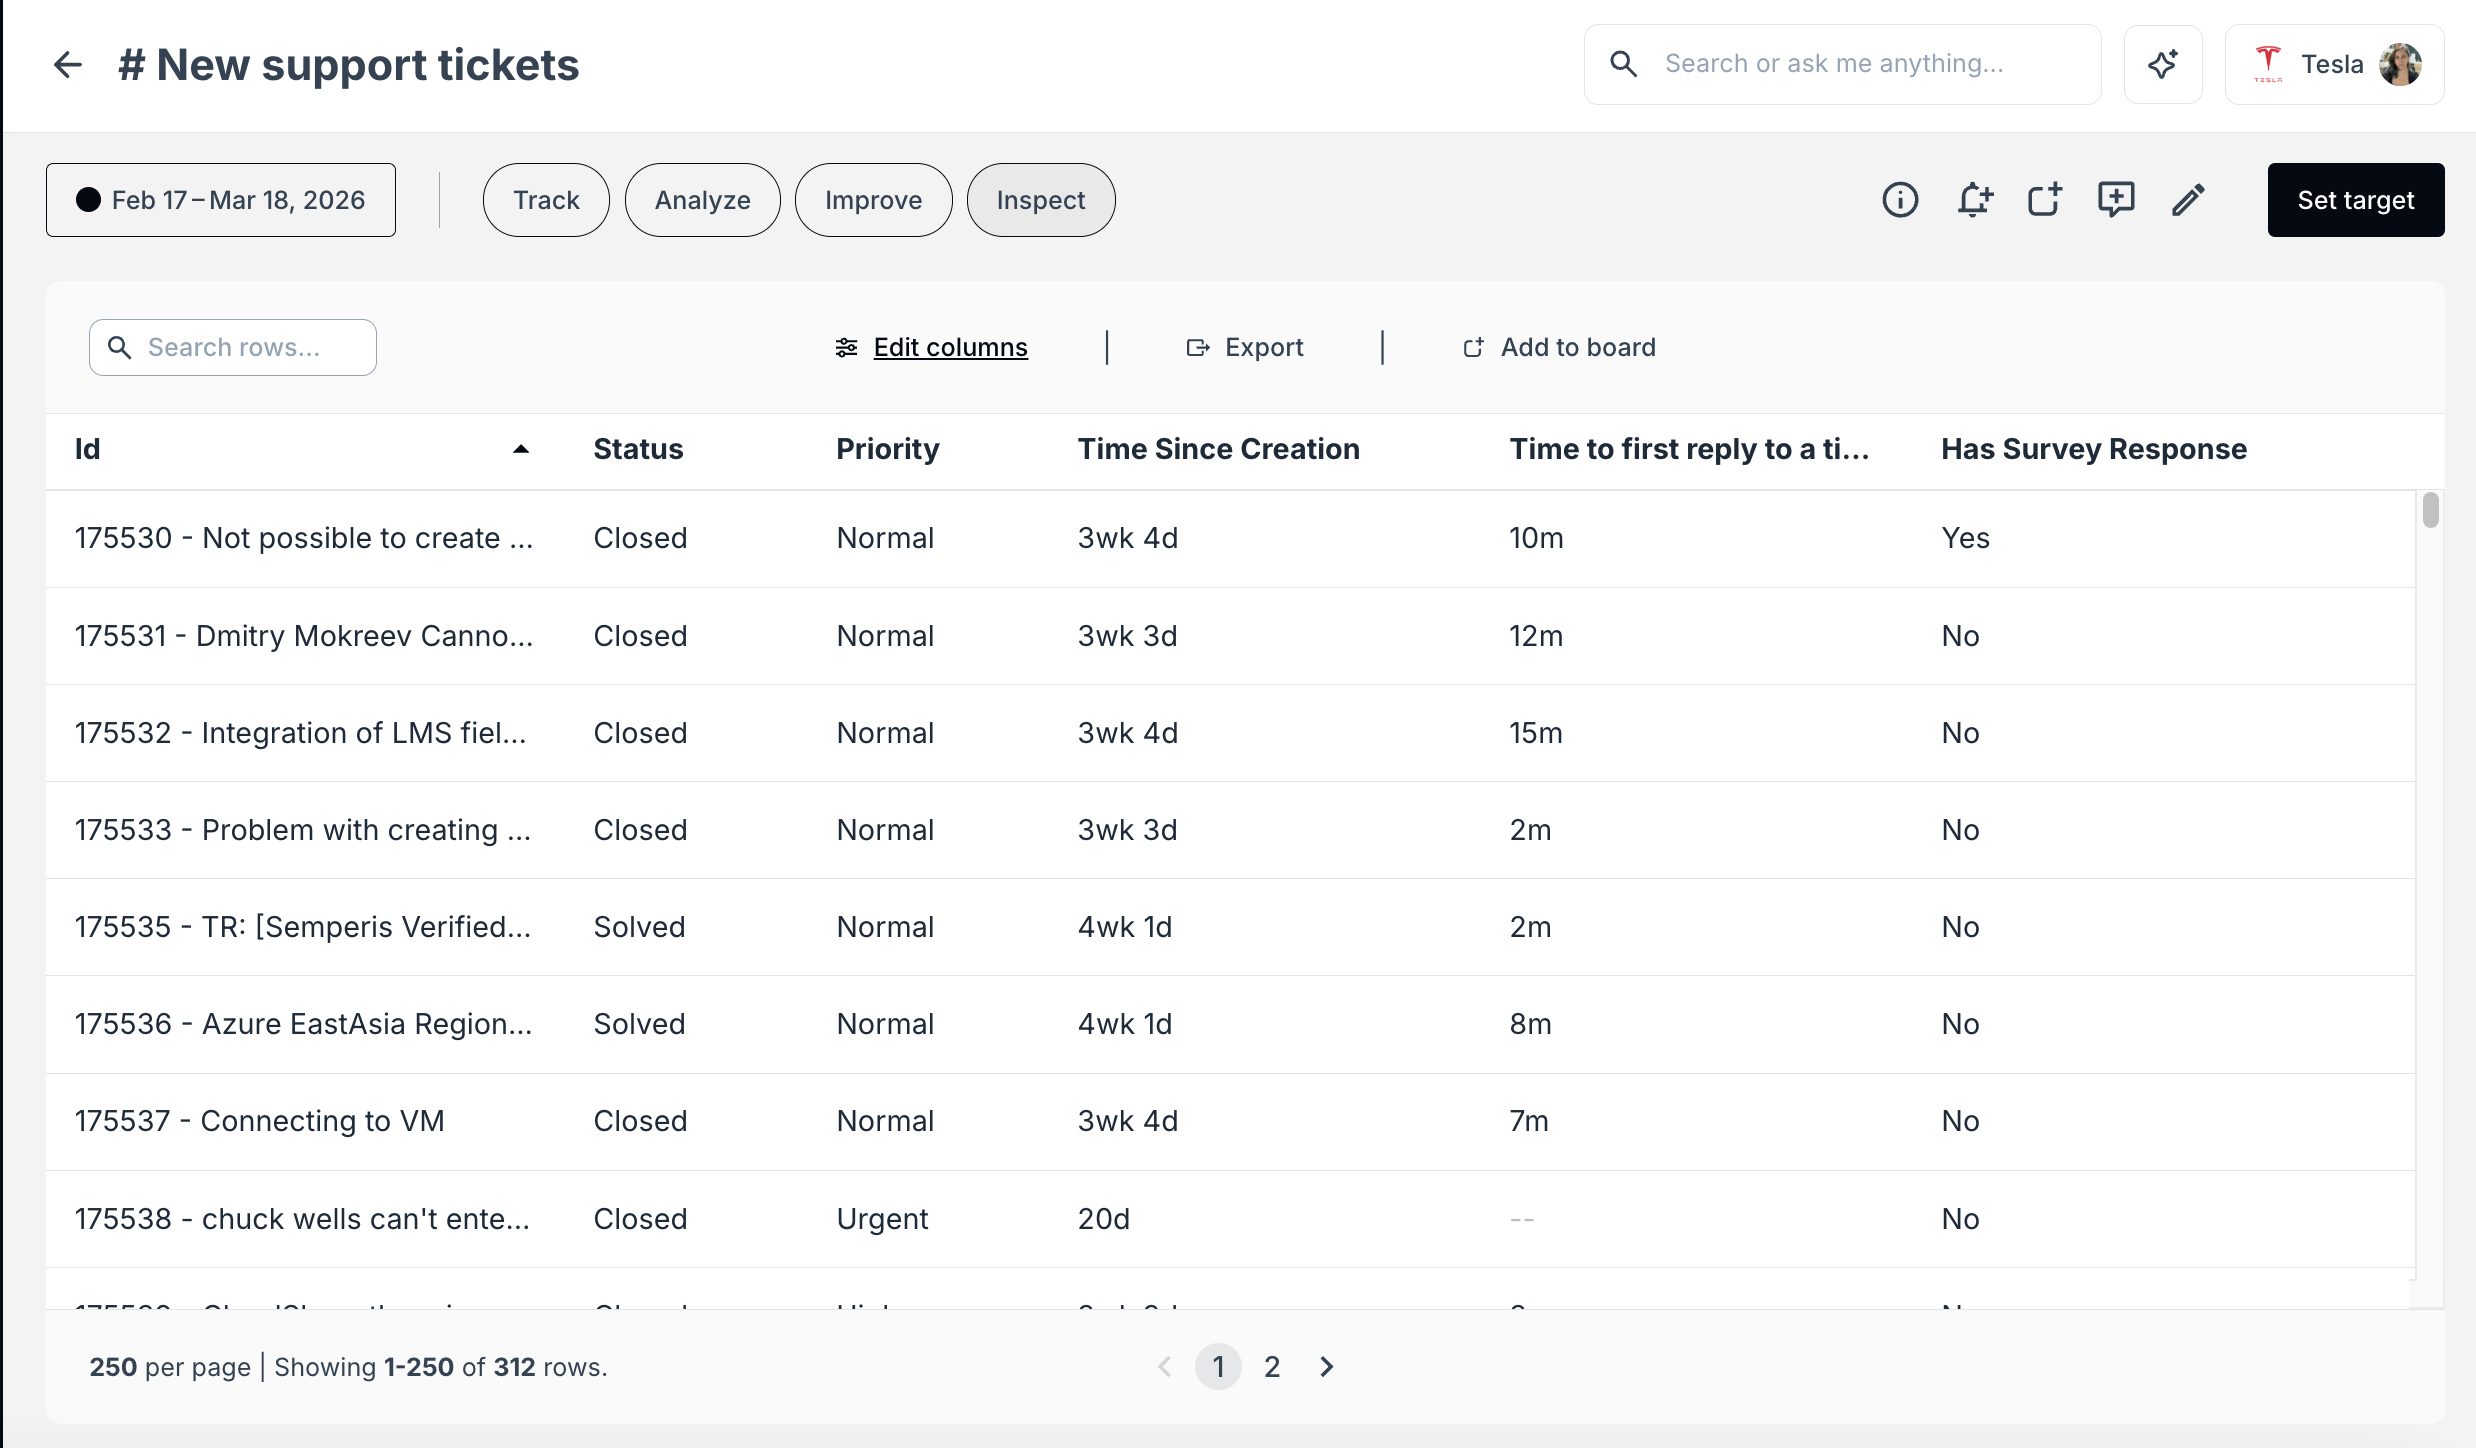
Option 2: Drill down into the metric and use the Inspect tab
How did we do?
Connecting to TargetBoard's MCP Server
Creating & Using Saved Filters