Calculated Metrics
Calculated metrics enable organizations to define and apply customized, weighted evaluation criteria across individuals, teams and projects. The only true limitation is what you can imagine based on your available data.
Data-Driven Performance Evaluation
Calculated metrics enable organizations to define and apply customized, weighted evaluation criteria across individuals, teams and projects. The only true limitation is what you can imagine based on your available data.
By translating qualitative performance dimensions into structured, weighted scoring models, these metrics provide transparent, data-backed insights aligned with your priorities.
Measuring team and individual performance has always been a complex task and is open not only to subjective input and criteria, but also gamification as it is difficult for leadership to focus simultaneously on all relevant areas and weigh them appropriately.
This results not only in data that lacks objectivity, but also frequently ends with employees focusing their efforts in the one or two easily measurable areas often used for this purpose and consequently not doing as well in other areas.
TargetBoard allows you to build not just a single scoring rubric for one type of position or team, but as many as you need to evaluate each on their own merits. So, while a software developer might be scored based on KPIs like cycle time, code complexity and completed tasks, you can simultaneously score an account executive on number and value of deals closed, time to close and overall value of new business brought in.
Case Study: Developer Scoring
Instead of relying on fragmented metrics or subjective review cycles, Developer Scoring allows leaders to operationalize what 'great performance' means in their organization and measure it consistently.
How it Works:
Step 1: Define Criteria Framework
Organizations configure weighted categories and sub-criteria aligned to their engineering philosophy and strategic goals.
Step 2: Aggregate Performance Data
Scoring integrates relevant delivery, quality, planning and collaboration data based on your defined criteria.
Step 3: Weighted Scoring Calculation
Each metric is normalized and calculated according to its assigned weight, producing a composite score.
Step 4: Insights and Reporting
Leaders can view performance at individual, team and organizational levels with full transparency into contributing factors.
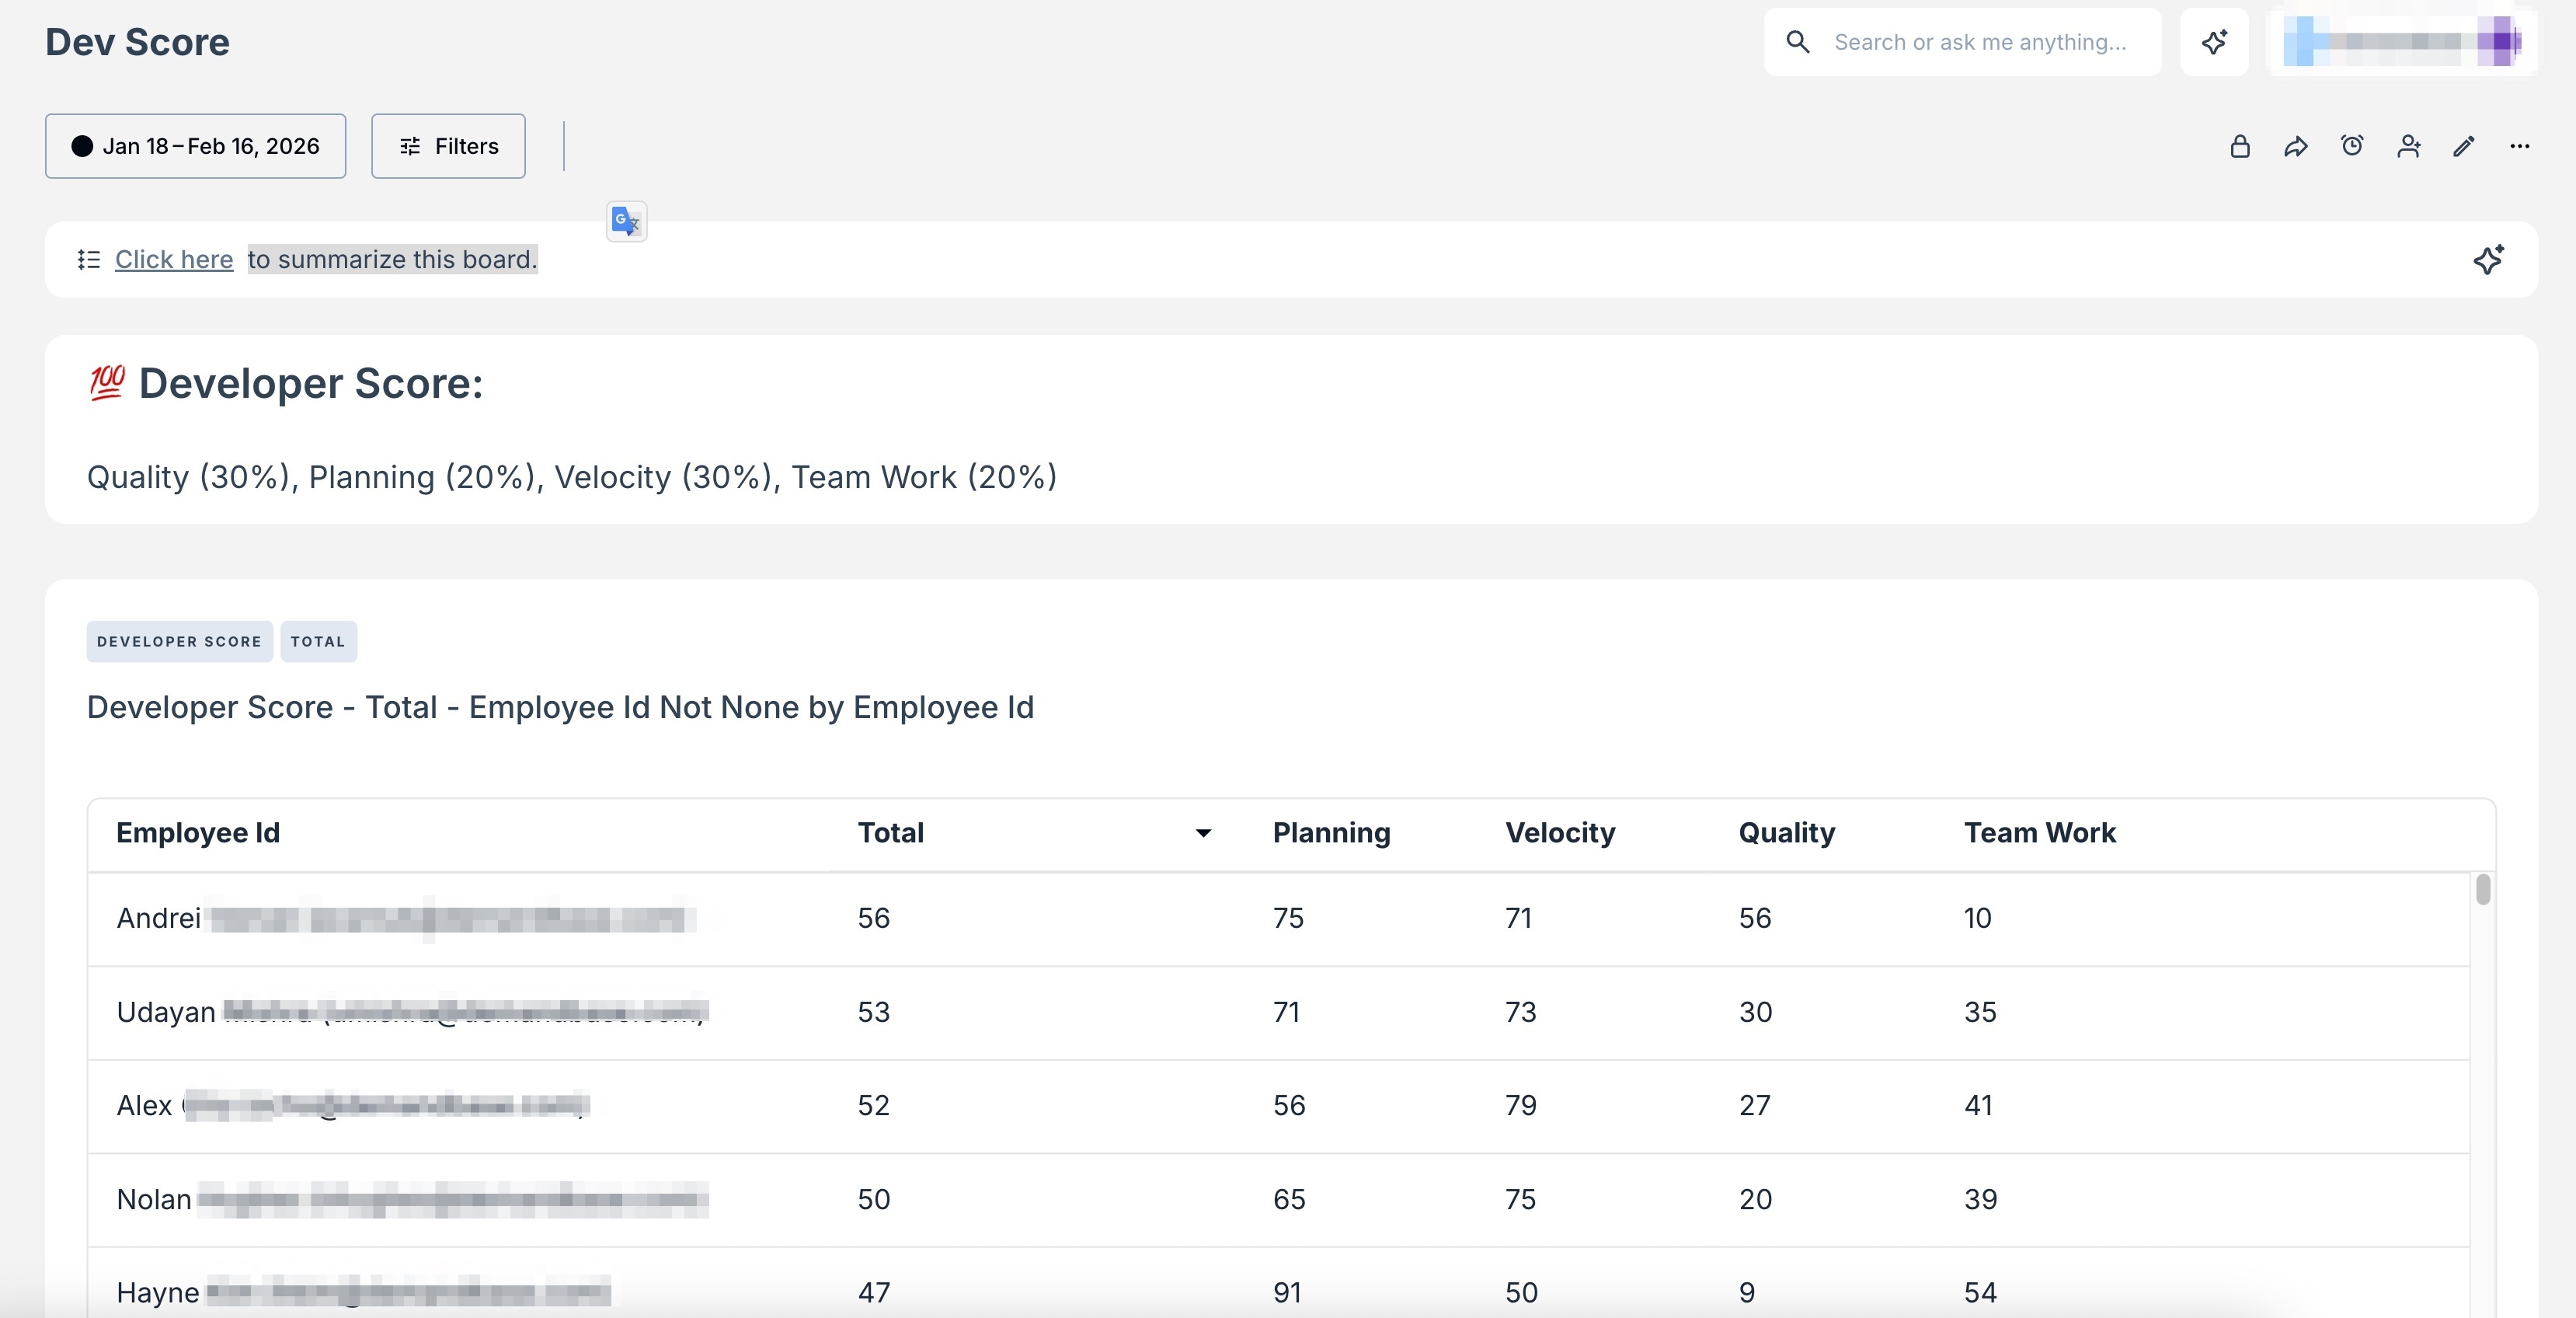
Sample Scoring Model:
Category | Weight | Sample Sub-Criteria |
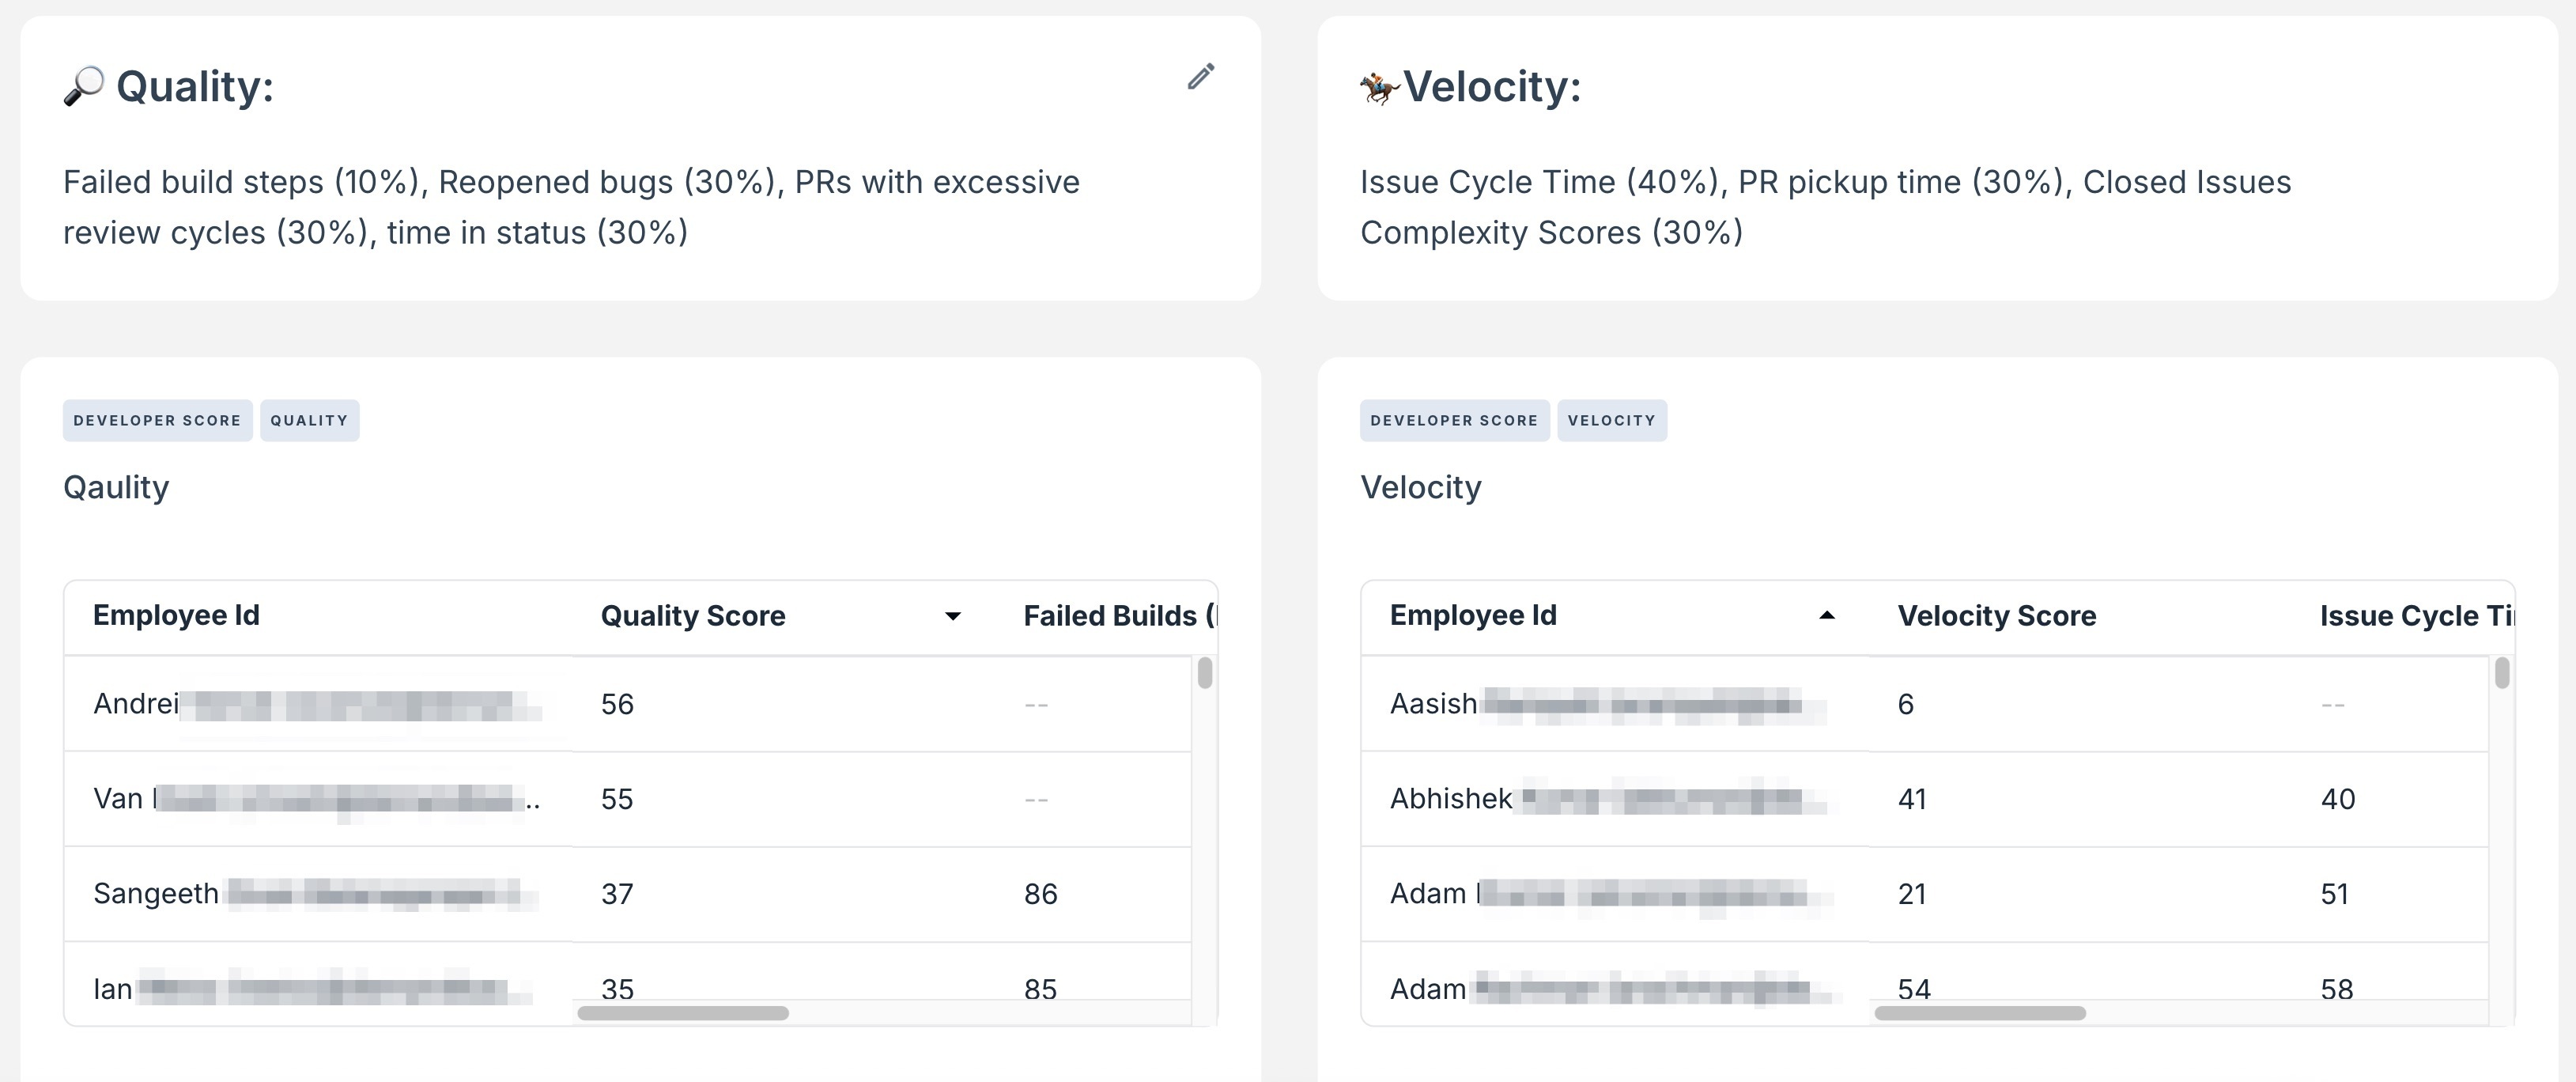
Quality | 30% | Failed build steps, reopened bugs, PR review cycles, time in status |
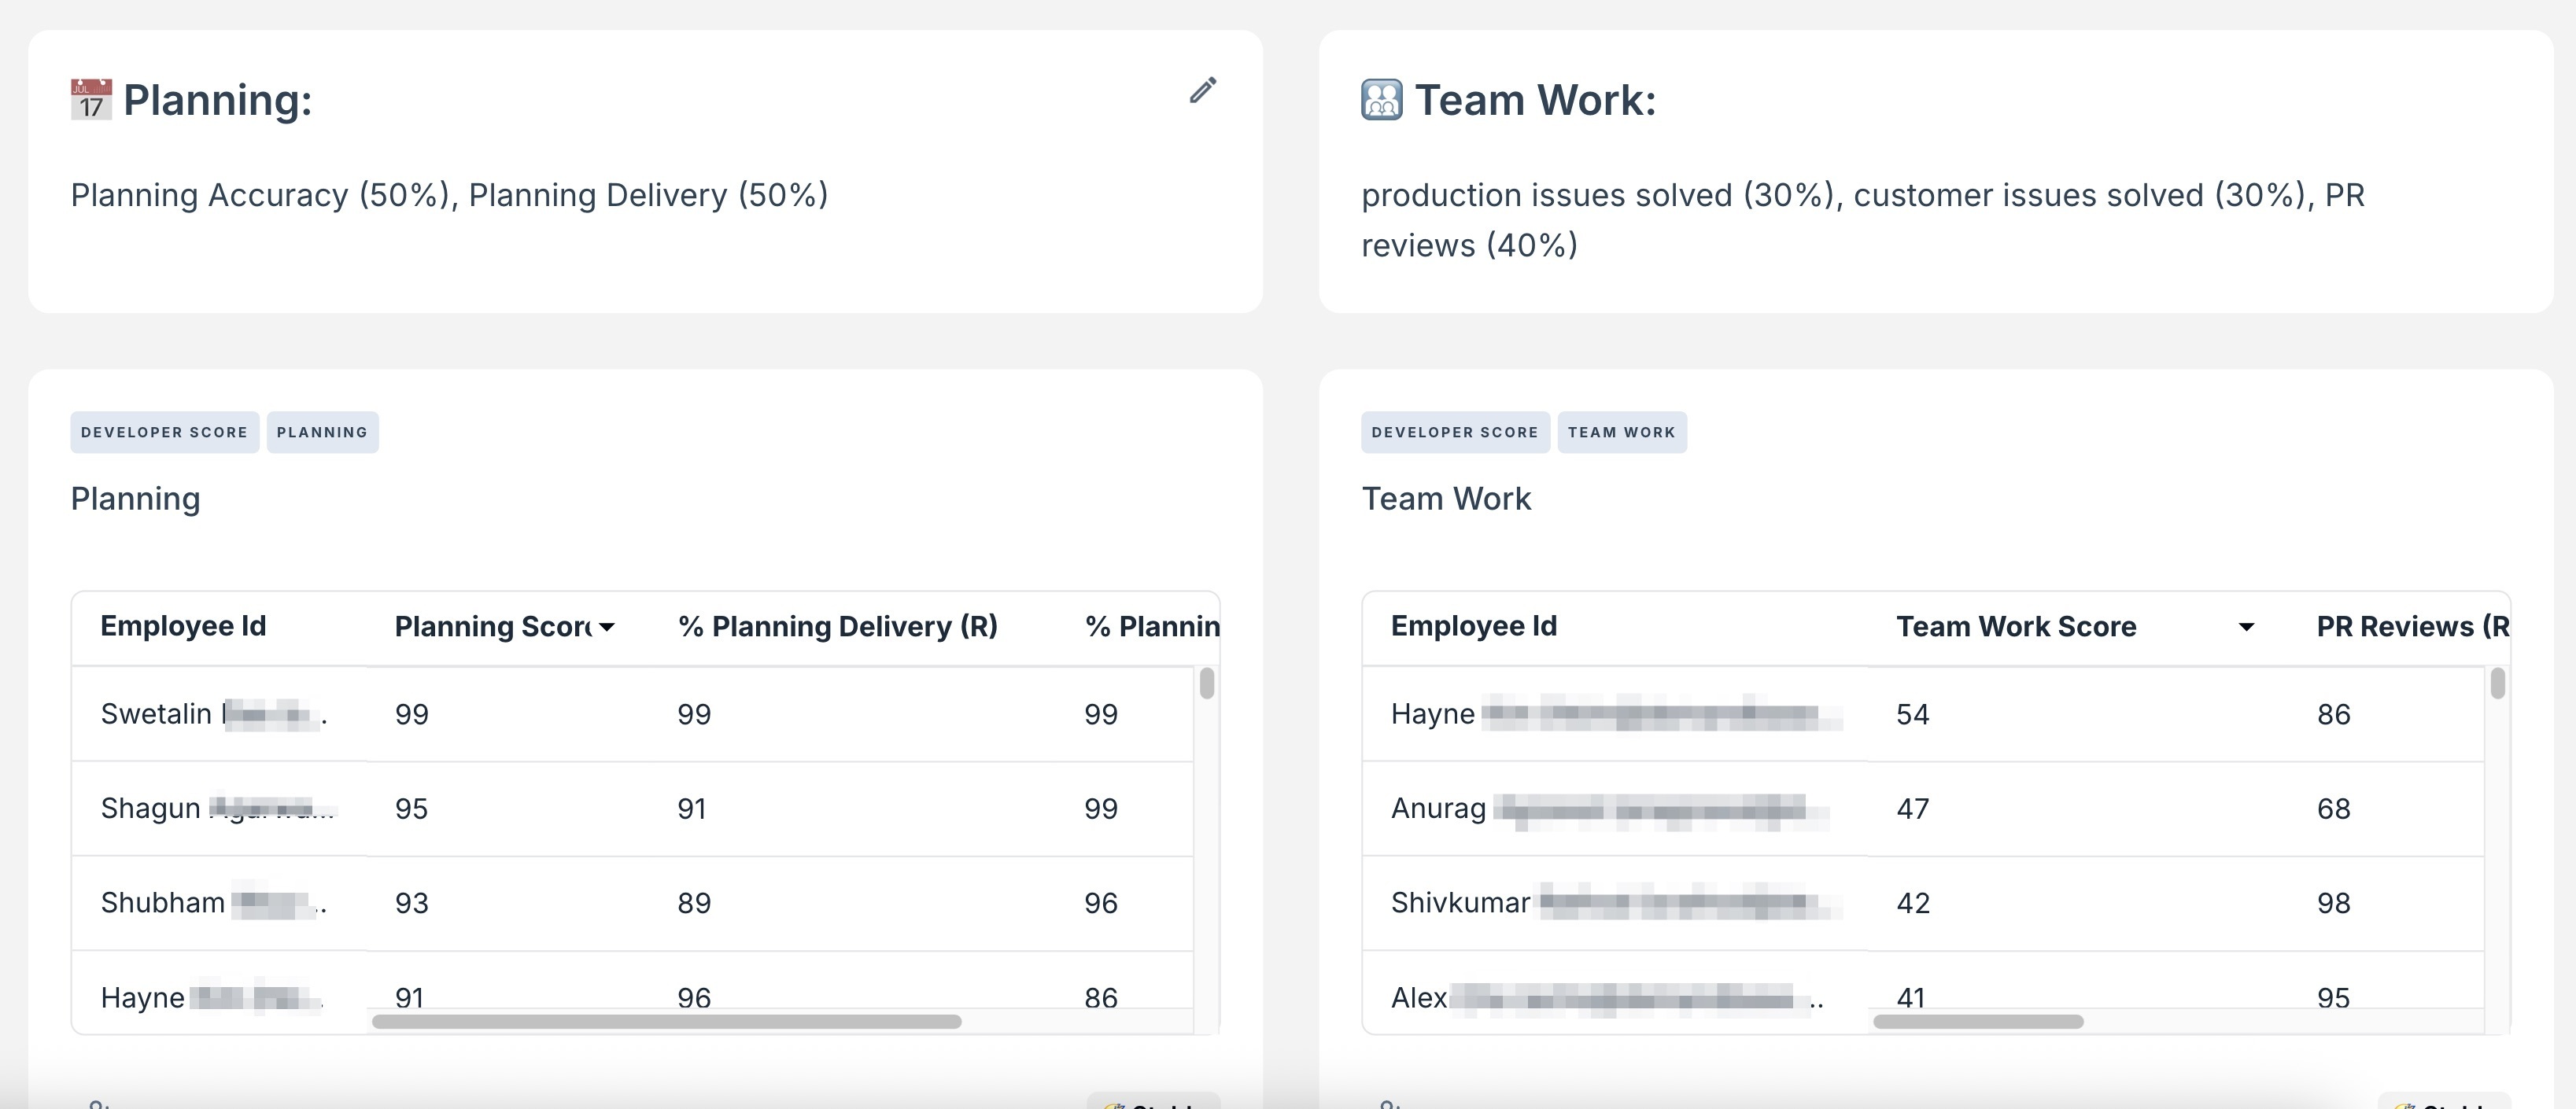
Planning | 20% | Planning accuracy, planning delivery |
Velocity | 30% | Issue cycle time, PR pickup time, Closed issue complexity |
Teamwork | 20% | Production issues solved, customer issues solved, PR reviews |
How did we do?
Filtering Capabilities