Measuring AI Impact for Engineering
Track AI adoption metrics alongside KPIs in TargetBoard to measure real business impact.
Track AI Adoption metrics and your other KPIs in parallel to measure impact
Once you've connected your AI coding tools to TargetBoard and started tracking AI Adoption metrics, that isn't the end of the story. Knowing who is using AI assistance and how much is just the first step in understanding how it is affecting your business outcomes
The ultimate goal of this is to set you up to see impact as early as possible and keep tracking it over time to make decisions based on real, objective data.
How AI Adoption is tracked
TargetBoard collects your Pull Request data including developer identity, programming language, number of commits, added and removed lines, timestamps, and review activity.
This is then compared with the activity recorded by your connected AI coding tools, eg: suggested lines, accepted lines, acceptance rations etc. If multiple AI tools are connected, the data is normalized accordingly so that developer names, programming languages and other key fields are standardized and can easily be compared across tools.
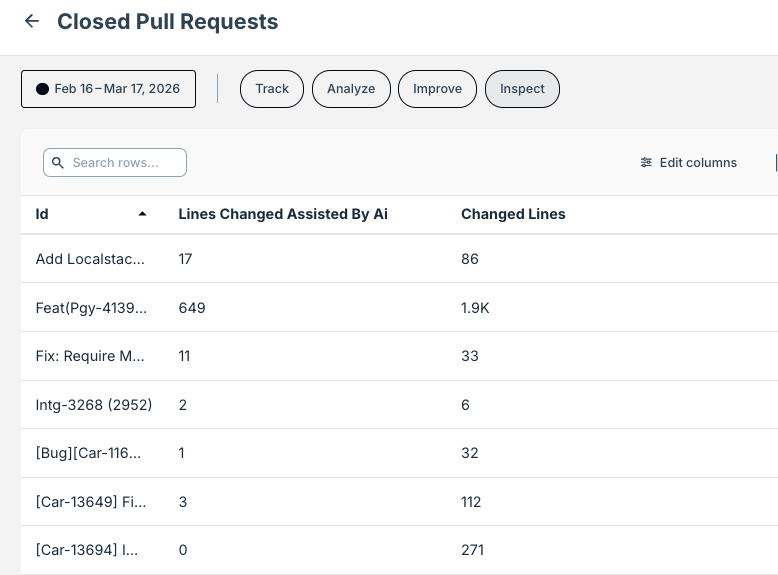
Finally, this is combined to show the core AI Adoption metrics available in your catalog. You can also view much of this data by individual pull request such as in the example below showing Closed Pull Requests with AI assisted lines and total number of lines changed side by side.
All of this collected data can then be tracked over time as your AI usage changes and matures. Furthermore it can be broken down by team, developer or any of the other dimensions active in your account to gain additional insights.
Measuring Impact
While AI adoption data is interesting, the real questions that every engineering leader has are things like 'Are my developers getting more done?' and 'Is AI affecting the quality of releases?'.
To start answering these questions and many others, you can use the same powerful TargetBoard metrics that are already providing intelligence on how your engineering organization is working and now look at them in parallel with your AI Adoption data.
For example, we can measure the number of epics being closed and the number of active developers in your organization as shown below. Note that the image shows 2025 data (dark gray) compared with 2024 data (light gray).
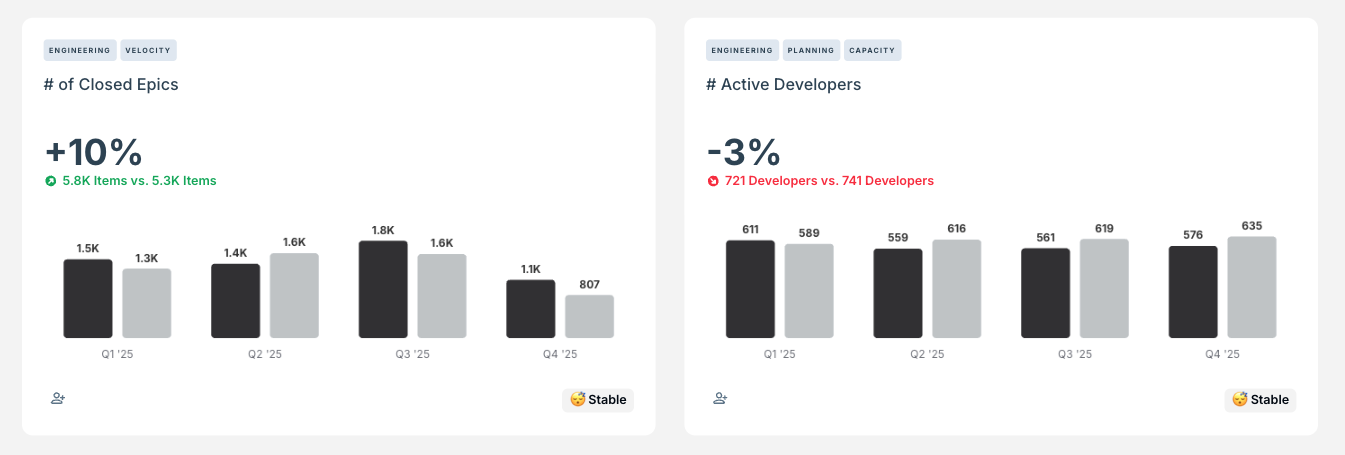
We can see an increase in the number of epics being completed, and a slight reduction in the number of developers working on those epics, indicating increased productivity per developer.
Typically, other metrics to track in this context include things like new bugs and incidents to see if there is any decrease in work quality as well as Pull Request Cycle Time, which is often reduced overall though it is also common to see an increase in Review time as PRs being closed faster can lead to bottlenecks in the review process.
Taking both your AI Adoption and impact metrics together empowers you to quickly identify trends and take action to keep your operations running as smoothly as possible as your AI usage matures over time.
How did we do?
Exploring Metrics
Connecting to TargetBoard's MCP Server