
Simply counting pull requests treats a one-line typo correction the same as a two-week feature. Delivery points fix that by weighing each merged PR by it's size and difficulty and how much the work behind it mattered to the business.
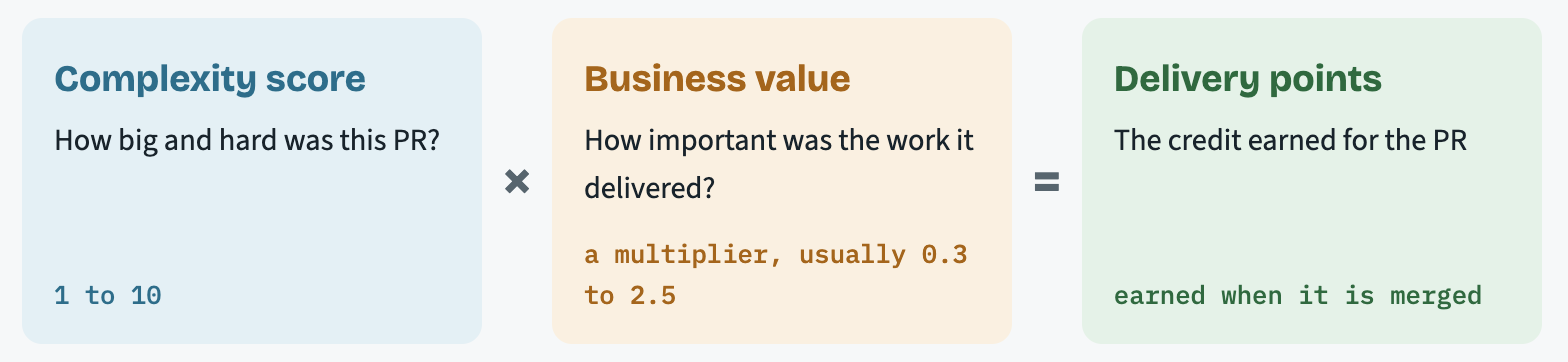
*Only merged PRs are scored. PRs that are closed without merging, or are still open, are not scored.
Complexity Score
Every merged PR gets a complexity score from 1 (trivial) to 10 (very large or difficult). It is calculated automatically from Git metadata.
What makes a PR more complex?
Signal | Why it matters |
Lines of code added | The strongest signal. More new code usually means more work. |
Number of commits | Work done in many steps tends to be more involved. Merge commits are not counted. |
Number of files changed | Changes spread across many parts of the codebase are harder to get right. |
Review comments from teammates | PRs that draw a lot of review discussion are usually trickier. Comments from bots, AI reviewers and the PR author are ignored. |
Pushes after the PR was opened (optional) | Rework in response to review is real effort. |
Dependency and version bumps (optional) | Routine “upgrade this library” PRs are scored lower because they typically take little thought. |
A few rules to keep the score fair
- Diminishing returns. Doubling the size of a PR does not double its score. Going from 10 to 100 lines matters a lot more than going from 1,000 to 1,100. This stops a single huge PR from skewing the data disproportionately.
- Missing data is handled. If a detail such as line counts wasn’t recorded, the score falls back on a reasonable assumption based on your company data instead of treating the PR as insignificant.
- Same work, same score. The score depends only on the PR itself. A PR of a given size scores the same whether it was written before or after your team started using AI tools. This also gives you an additional way to measure productivity increase post-AI.
- Calibrated, not guessed. How much each signal counts was set by comparing these signals against a large sample of PRs that had been reviewed and rated for difficulty. The weights can also be fine-tuned on your organization’s own history.
Business Value
Business value is a multiplier that reflects how important the work was.
A value of 1.0 is neutral. Work that drives new revenue or strategic goals has a higher value, while routine upkeep work is treated as lower value.
A PR takes the business value of the ticket it is linked to, such as the Jira issue referenced in its title or branch name. That ticket’s importance is judged from information your teams already track, most often:
- Priority: Critical, High, Medium, Low etc.
- Type of work: new product feature, enhancement, technical improvement, maintenance etc.
- The bigger initiative the work rolls up to, such as a top company initiative or a high-profile launch.
PRs with no linked ticket still earn points, at a slightly reduced business value, as they are more likely to be maintenance or similar tasks if they are not linked. Linking PRs to tickets gives a more accurate picture.
Delivery Point Uplift
Uplift answers the questions most engineering leaders are asking: Is the team shipping more today than we were last quarter or last year? Are we getting more done after adopting AI than before?
- Pick a benchmark period. A window of a few months you want to use as your starting point for comparison.
- Learn each developer’s normal pace. How many delivery points they earned from merged PRs per day during the benchmark. Only months employees actually merged work are used, so vacations or onboarding months don’t drag the baseline down.
- Compare today against that pace. Uplift is how far above or below their own baseline each developer is now.
Expected at old pace: 40 points
Actually delivered: 52 points → +30% uplift
The same comparison is also made for the number of merged PRs, so you can see whether a team is shipping more PRs, bigger and more valuable PRs, or both.
Safeguards keep the comparison honest:
- Developers who joined after the benchmark, or had too little activity during it, are compared against the company average instead.
- A developer’s baseline can’t be set unrealistically low (by default, never below a quarter of the company average), which prevents inflated uplift numbers.
- Developers who stop merging work for an extended period drop out of the comparison.
Where can scoring be customized?
These settings can be adjusted for your organization with the TargetBoard team.
Complexity weights | How much each signal counts (lines added, commits, files changed, review comments, pushes after opening, dependency bumps). Can be re-tuned on your own history so scores match how your teams work. |
Business value rules | Which fields drive importance (e.g. priority, work type, custom fields), and how they are weighted. |
Points formula | Can be simplified or have additional factors added to best suit your company needs. |
Duplicate detection | How much a PR must overlap with already-merged commits before it is treated as a duplicate rather than new work. |
Benchmark period | The comparison window used for uplift. |
Uplift safeguards | The lowest allowed baseline relative to the company average, and how long a developer can be inactive before leaving the comparison. |